Figure 1.
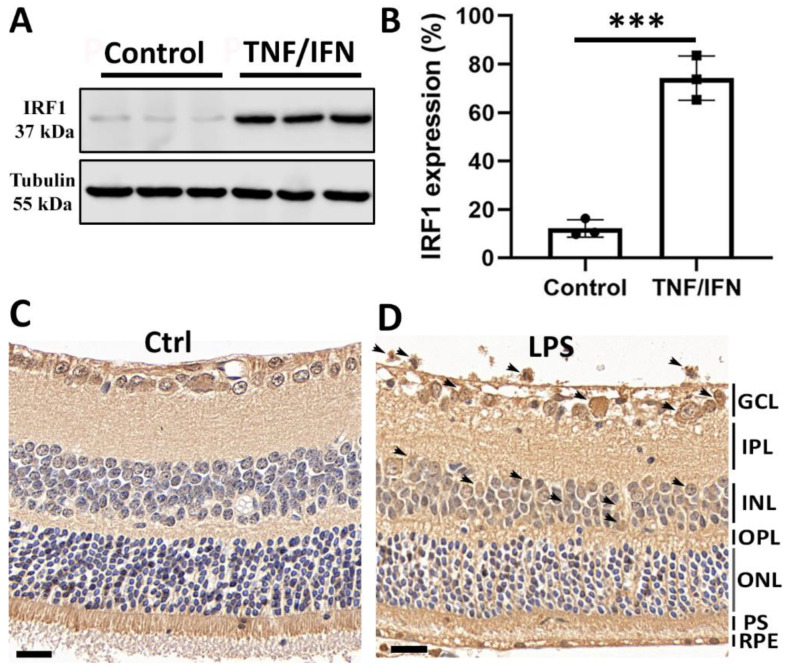
Increased IRF1 protein expression level in activated retinal microglia. (A,B) IRF1 protein upregulation in primary retinal microglia by 20 ng/mL tumor necrosis factor-alpha (TNFα) and 20 ng/mL interferon-gamma (IFNγ) for 24 h. The Western blot images of IRF1 ((A), Tubulin as loading control) and densitometric quantification results by ImageJ software ((B), % of Tubulin) are shown. Primary retinal microglia were derived from mice (~p10). The replicate numbers = 3. *** p < 0.001. (C,D) The increased IRF1 protein level in the mouse retina by lipopolysaccharide (LPS, 100 ng/µL) for 24 h. The representative IHC-DAB staining images (n = 3) for the PBS control (C) and LPS (D) treatments ae shown. Arrows indicate the IRF1 staining signals. Scale bar: 20 µm.

