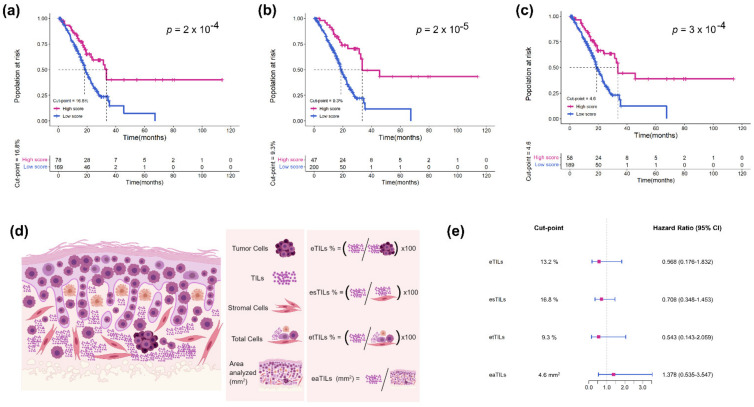
Figure 6.
Assessment of four TILs variables including eTILs, etTILs, esTILs, and eaTILs. Kaplan–Meier survival curves for (a) etTILs, (b) esTILs, and (c) eaTILs with optimal cut-points in TCGA cohort. (d) Schematic diagram illustrating the four TILs variables. (e) Forest plot of the four TILs variables with optimal cut-points in TCGA cohort.

