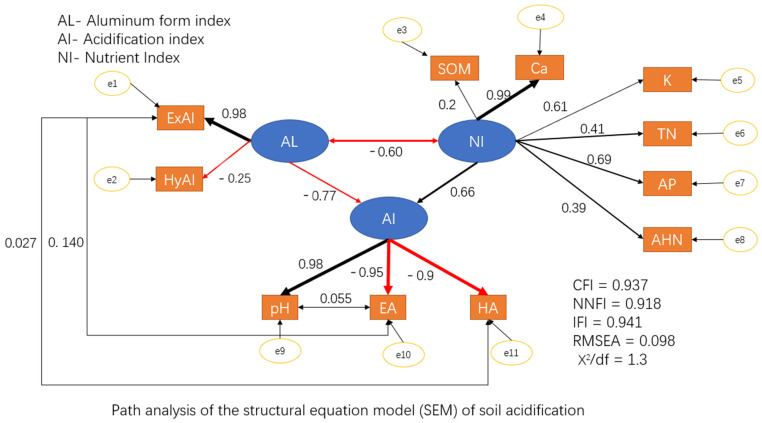
Figure 6.
Correlation analysis of the soil parameters by the structural equation model. The thick solid lines indicate the significant correlation path (p < 0.01), and the thin lines indicate the nonsignificant correlation path. The number next to each line is the standardized path coefficient, and the width of an arrow indicates the strength of the relationship.

