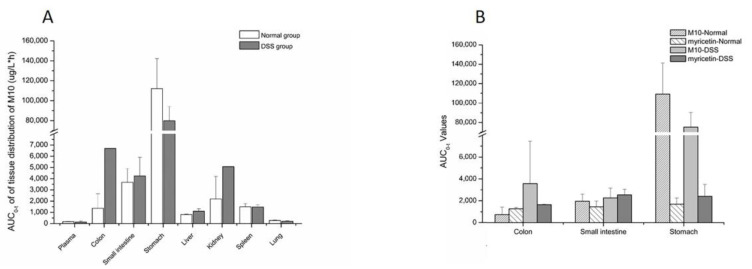
Figure 4.
AUC0-t values of M10 and myricetin in tissues. (A) AUC0–t values of M10 in tissues after oral administration of M10 (50 mg/kg) in colitis and normal mice; (B) the comparison of AUC0-t values of M10 and myricetin in tissues after oral administration of M10 (50 mg/kg) in colitis and normal mice.

