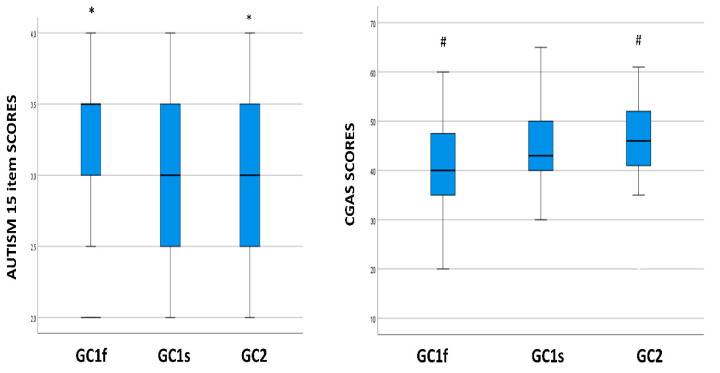
Figure 1.
Boxplot of the distribution of autism 15 item and CGAS scores in relationship with the GC isoform genotypes. Within each box black lines denote median values. Statistically significant pairwise comparisons are reported: *: p = 0.014 and #: p = 0.004. CGAS: Children’s Global Assessment Scale.

