Figure 11.
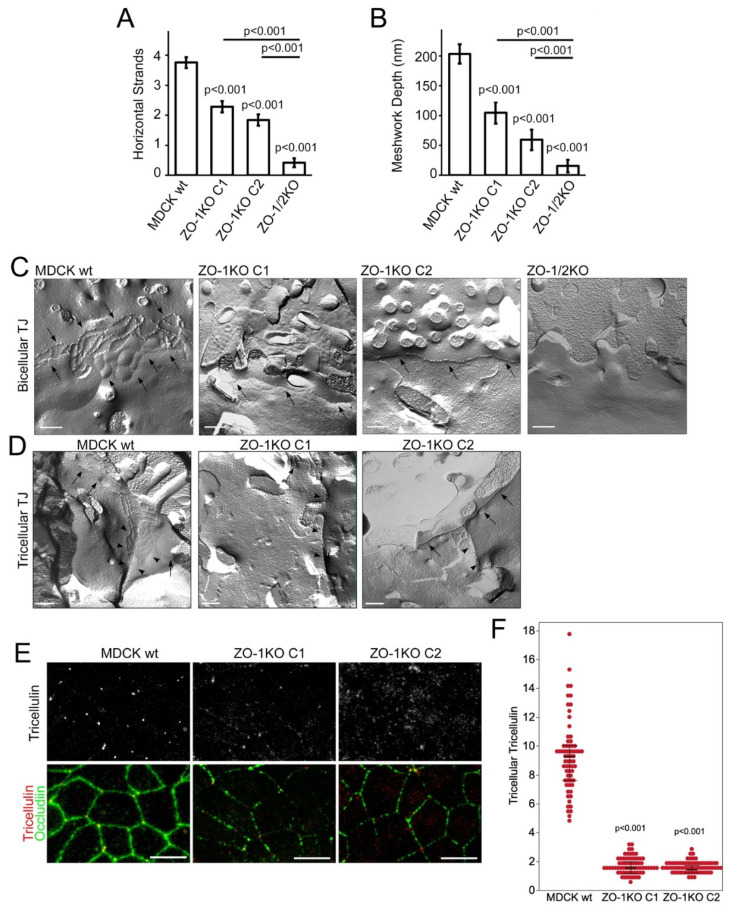
ZO-1-deficiency disrupts TJ ultrastructure. Freeze fracture analysis of TJ ultrastructure of confluent control (wt) and knockout MDCK cells. (A) Numbers of horizontal strands were reduced in ZO-1 KO cells as well as in the ZO-1/2 double KO clone. The double KO cells exhibited even more strongly reduced numbers of strands compared to the ZO-1 KO cells. Note, often no or only one TJ strand could be observed in various replicas of the double KO. (B) The meshwork extension was drastically reduced in ZO-1 KO cells as well as in the ZO-1/2 KO cells. Note, for occurrence of one strand no extension existed. The quantifications are based on the analysis of MDCK wt, 53; ZO-1KO C1, 28; ZO-1KO C2, 25; and ZO-1/2KO, 29 TJ. (C) Representative images of bicellular TJ in MDCK wt and the respective ZO-1 and ZO-1/2 KO cells. Arrows indicate intramembrane strands. (D) Images of tricellular TJ of MDCK wt and the ZO-1 KO cells suggested that in the ZO-1 KO only the central tube was present and the typical horizontal branches as seen in the wild-type controls cells were missing. Arrowheads point to intramembrane strands that are part of tricellular junctions and arrows to strands in bicellular junctions. (E,F) Confocal maximum intensity projections of junctional xy-sections taken from cells stained for tricellulin and occludin. Panel (F) shows quantifications of accumulation of tricellulin in tricellular corners. Magnification bars, (C,D) 200 nm; (E) 20 µm.

