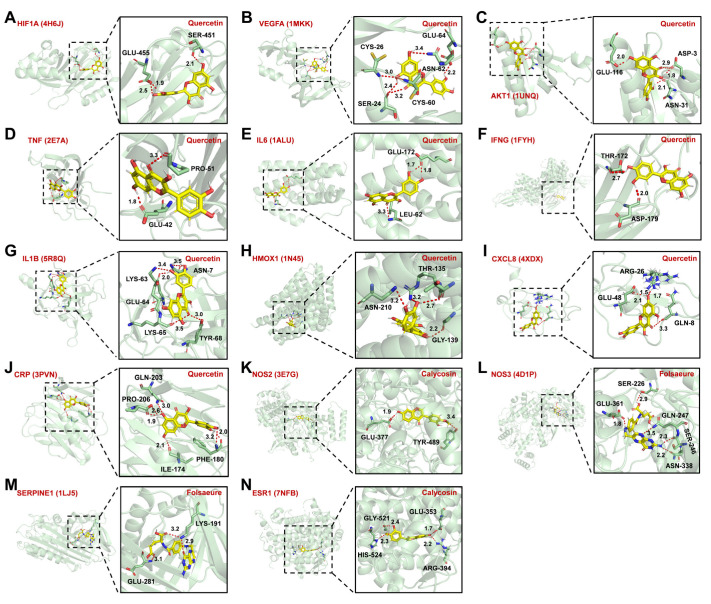
Figure 7.
Molecular docking of core targets with active components. (A–J) Molecular docking pattern of quercetin with HIF1A (A), VEGFA (B), AKT1 (C), TNF (D), IL6 (E), IFNG (F), IL1B (G), HMOX1 (H), CXCL8 (I), and CRP (J). (L,M) Molecular docking pattern diagram of folsaeure with NOS3 (L) and SERPINE (M). (K,N) Molecular docking pattern of calycosin with NOS2 (K) and ESR1 (N). The 3D structures of core targets were from the PDB database with the corresponding PDB ID listed in parentheses after the target name. Molecules were anchored into the active pocket by binding to amino acid residues of the core target. Intermolecular hydrogen bonds were displayed as red dashed lines with bond lengths annotated next to them in angstroms.

