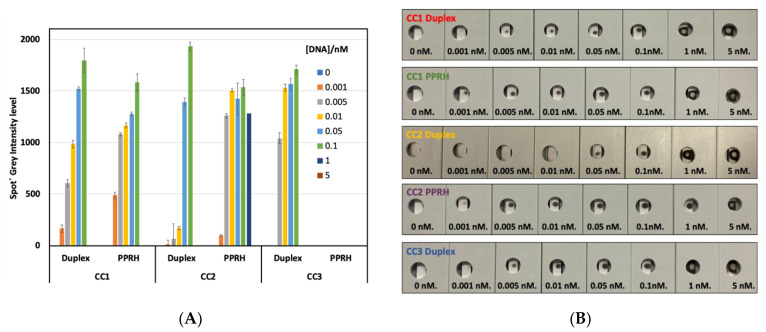
Figure 6.
Results obtained with the thermal lateral flow system. (A): Profile of ipeak® (IUL S.A. commercial lateral flow reader) quantification of spiked samples with different concentrations of targets (from 0 to 5 nM) in UTM using capture sequences duplex-CC1, CC2, and CC3 duplex and PPRH-CC1 and CC2. Results with PPRH-CC3 sequence are not shown in this graph because NPRs aggregation was observed during the testing assay. Grey level intensity measurements were obtained from the LF reader to determine the value of LOD of the thermal lateral flow system. Standard deviation of three replicates carried out consecutively is drawn as error bars. (B): Image obtained from the back part of the LF strips (thermosensitive material) after the laser irradiation using a 1064 nm laser. The strips were loaded with spiked samples in UTM from Biocomma with different concentrations of DNA, from 0–5 nM, to determine the visual LOD of the system.

