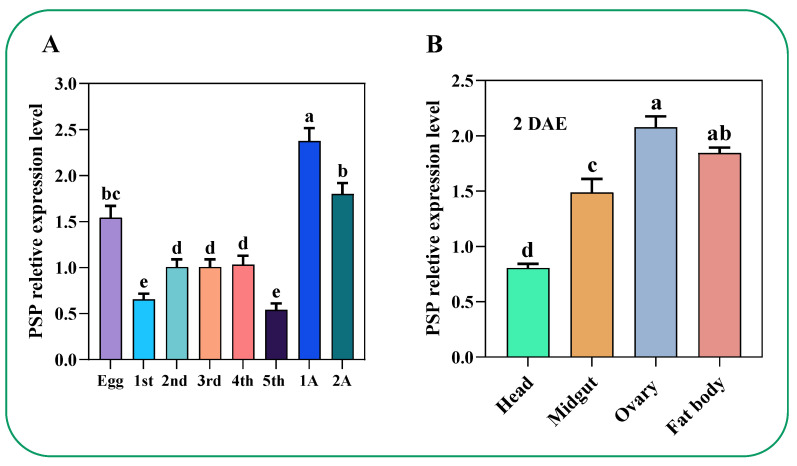
Figure 5.
Temporal and development variations of PSP expression in the mentioned life stages. (A) represents the PSP expression in developmental stages, 1A represents one day after emergence (one day old), and 2A (two days old), whereas (B) represents the expression in selected segments and tissues. Histogram bars indicate expression, and error bars show means ± SEM. Bars annotated with different lowercase letters are statistically significant at p < 0.05 (Tukey test), and DAE is after emergence days.

