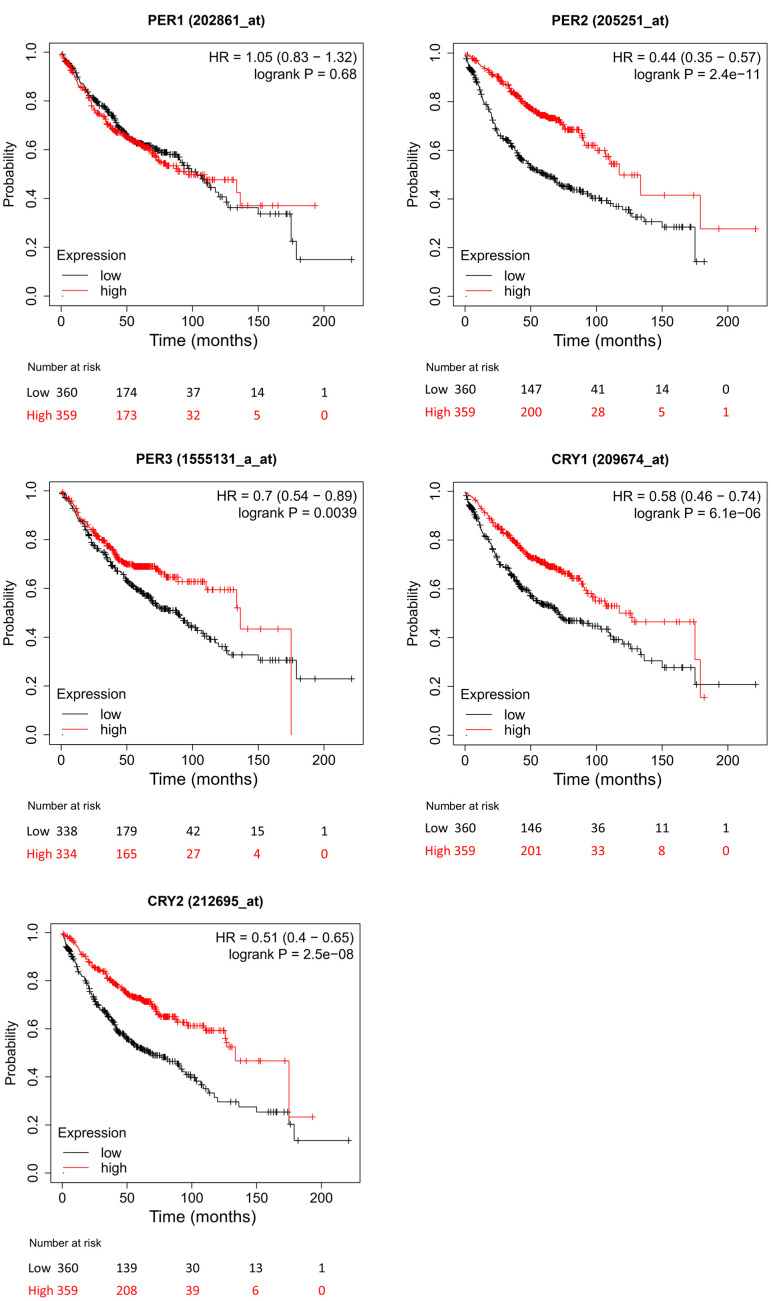
Figure 4.
Different expressions of PER (period) and CRY (cryptochrome) family members in lung adenocarcinoma (LUAD) patients in the overall survival (OS) curve (using the Kaplan-Meier plotter). The red line represents the survival rate curve of patients with LUAD who expressed the gene, and the black line represents the survival rate curve of LUAD patients who did not express the gene.

