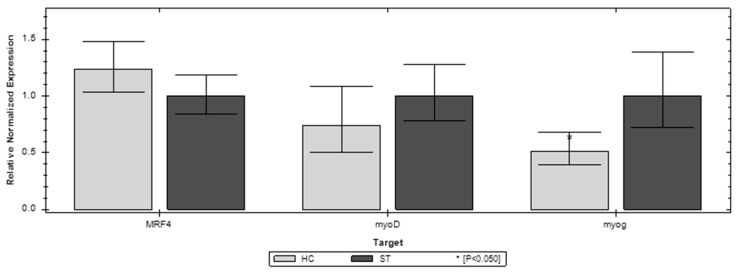
Figure 4.
Relative expression of the MFR4, myoD, and myoG genes on the 21st day (D21) of life in the standard (ST) and HatchCare (HC) groups (p = 0.261 for MRF4, p = 0.229 for myoD, and p = 0.008 for myog). Significant difference compared to ST (* p < 0.05). The figure was generated with CFX Maestro Software 2.3.

