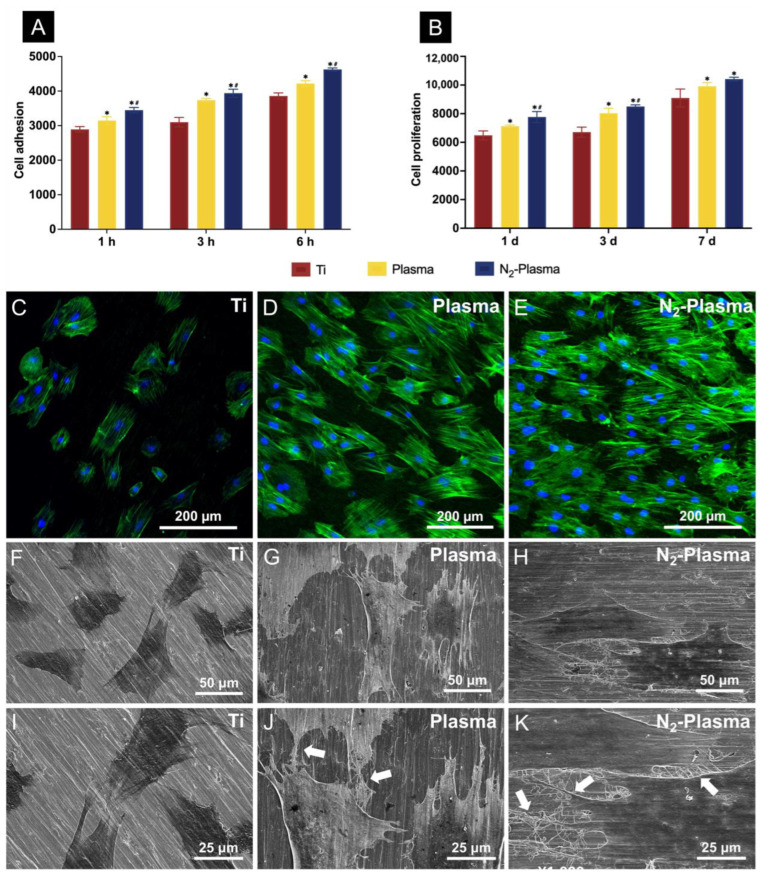
Figure 3.
(A) Cell adhesion and (B) proliferation of rBMMSCs attached to the Ti, Plasma, and N2-Plasma discs. Morphological analysis of rat bone marrow mesenchymal stem cells (rBMMSCs) attached to the (C) Ti, (D) Plasma, and (E) N2-Plasma discs after 24 h of culture. Actin filaments (green) were labeled with Alexa Fluor 488 phalloidin, and nuclei (blue) were stained with 4′,6-diamidino-2-phenylindole. SEM analysis of the morphology of rBMMSCs attached to the (F,I) Ti, (G,J) Plasma, and (H,K) N2-Plasma discs after 24 h of culture. Images obtained at a lower magnification (F–H) show the morphology of single cells, whereas images obtained at a higher magnification (I–K) show the detailed interactions between cells on different samples (white arrows indicate connections between cells). * p < 0.05 compared with Ti; # p < 0.05 compared with Plasma.

