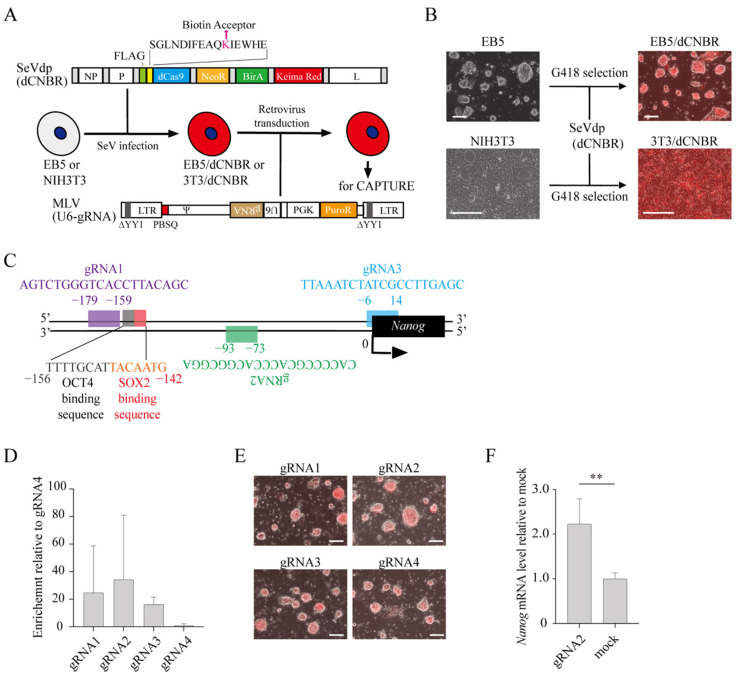
Figure 1.
Generation of mouse embryonic stem cells (mESCs) for CAPTURE of the Nanog promoter. (A) Structure of vectors and experimental procedure for the CAPTURE method. SeVdp(dCNBR) vector expresses proteins for CAPTURE including dCas9, the neomycin resistant gene (NeoR), biotin ligase (BirA) and Keima-Red. dCas9 was fused with a FLAG-tag and biotin acceptor sequence at its N-terminus. After selection of SeVdp(dCNBR)-infected mESCs or NIH3T3 cells (EB5/dCNBR or 3T3/dCNBR, respectively), MLV(U6-gRNA) was transduced to express guide RNA (gRNA) as well as the puromycin resistant gene (PuroR). NP, P, and L; genes encoding Sendai virus NP, P, and L proteins, respectively. ∆YY1 and PBSQ; mutations in the YY1-binding site and primer-binding site, respectively. LTR; long terminal repeat. ψ, packaging signal. U6; U6 promoter. PGK; PGK promoter. (B) Keima-Red expression from SeVdp(dCNBR). EB5 and NIH3T3 cells were infected with SeVdp(dCNBR) followed by selection with 800 µg/mL and 1 mg/mL of G418 for 3 and 7 days, respectively. Scale bars, 200 µm. (C) Positions of gRNA target sequences on each strand of the Nanog promoter. OCT4 and SOX2 binding motifs are also indicated. (D) Enrichment of the Nanog promoter DNA by CAPTURE with gRNAs. Chromatins were collected from EB5/dCNBR cells expressing the indicated gRNA, and fragmented chromatins were affinity-purified with streptavidin beads. Enrichment of the Nanog promoter in the purified chromatins was determined by qPCR. Enrichment was normalized by fold enrichment of gRNA4-transduced control. Data represent the mean ± SEM of three independent experiments. (E) Morphology of EB5/dCNBR cells transduced with gRNA-expressing retroviral vector. After transduction of MLV(U6-gRNA) expressing indicated gRNA, cells were selected by 2 µg/mL puromycin for 2 days. Scale bars, 200 µm. (F) Nanog expression in cells for CAPTURE of the Nanog promoter. Nanog mRNA levels in EB5/dCNBR cells with gRNA2 was determined 5 days after puromycin selection. mRNA level was normalized by that of mock-transduced EB5 cells. Data represent the mean ± SEM of three independent experiments. ** p < 0.01.

