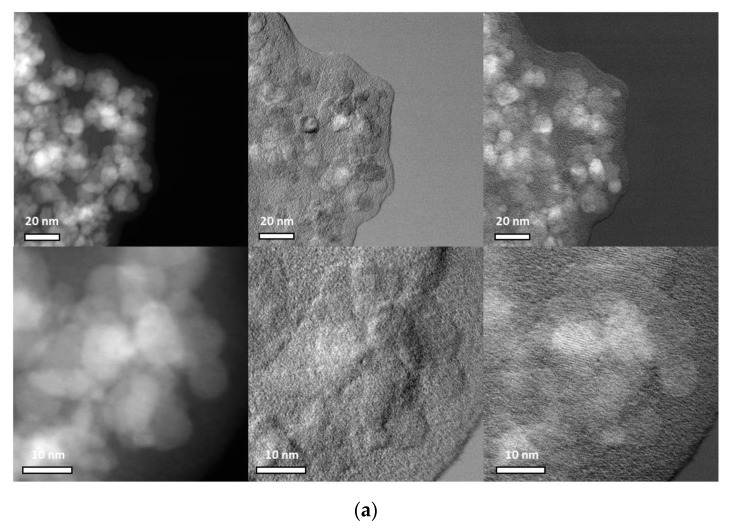
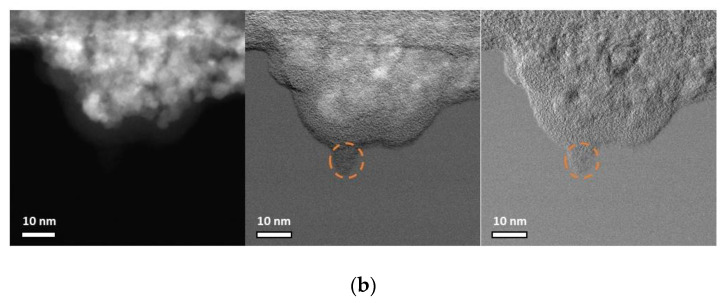
Figure 3.
HAADF-STEM micrographs indicate the nanoparticle core with an amorphous coating for (a) ION@CMD6.25 and (b) ION@CMD250 on the left. The picture in the middle shows DPCx (A–C), and the right one shows DPCy (B–D). The orange markers show the artifacts created by the scanning electron beam. Scale bars are inset.


