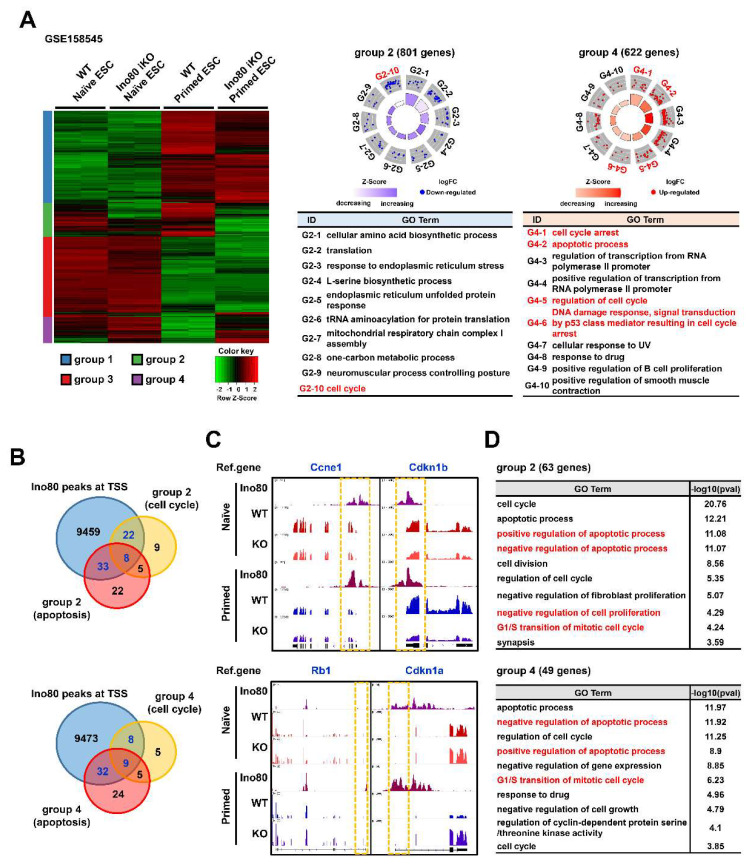
Figure 2.
Ino80 directly regulates genes involved in cell cycle. (A) Heatmap and GO circle plot showing DEGs and GO terms of GSE158545. Unsupervised grouping with 5483 DEGs in total (cutoff value, FC ≥ 2, FPKM ≥ 2) resulted in 4 groups; group 1 (2170 genes), group 2 (801 genes), group 3 (1890 genes), and group 4 (622 genes). GOBP for group 2 and 4 genes were visualized through GO circle tool. Cell cycle- and apoptosis-related terms are highlighted in red fonts. DEGs, differentially expressed genes. GO terms, gene ontology terms. FC, fold change. FPKM, fragments per kilobase of transcript per million. GOBP, Gene Ontology Biological Process. (B) Venn diagram showing common genes among cell cycle, apoptosis, and Ino80 targets in the group 2 and 4. “Ino80 peaks at TSS” gene was defined as a gene which Ino80 was detected in TSS (GSE158545). Common genes are highlighted in blue fonts. TSS, transcription start site. (C) Visualization of representative cell cycle-related genes with Ino80 bindings and expression levels using the IGV. Yellow dotted line indicates TSS. IGV, Integrative Genomics Viewer. (D) GO term analysis with genes that Ino80 binds to TSS and are involved in cell cycle or apoptosis in group 2 (63 genes) and group 4 (49 genes). The tables show the GO terms and −log10(p-value). Cell cycle- and apoptosis-related terms are highlighted in red fonts.

