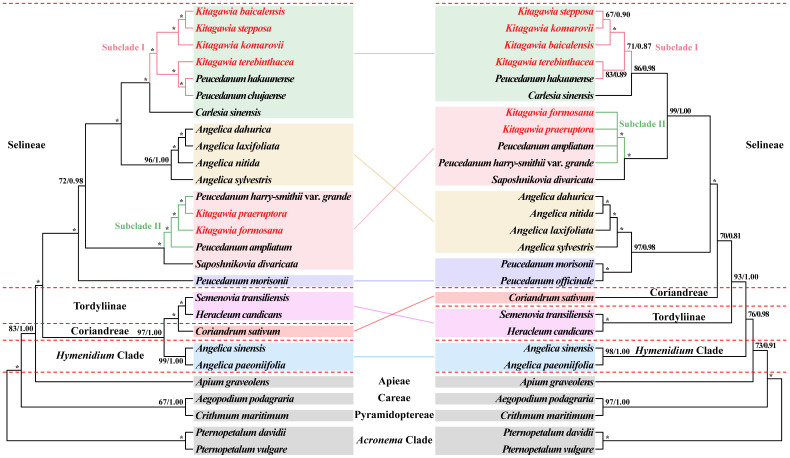
Figure 1.
Phylogenetic trees constructed by maximum likelihood (ML) and Bayesian inference (BI). The bootstrap values (BS) of ML and posterior probabilities (PP) of BI are listed at each node. (*) represents maximum support in both analyses. Colored blocks indicate the main clades or branches with inconsistent phylogenetic placements in both phylogenetic trees. (Left): CDS tree; (Right): nrDNA (ITS + ETS) tree.

