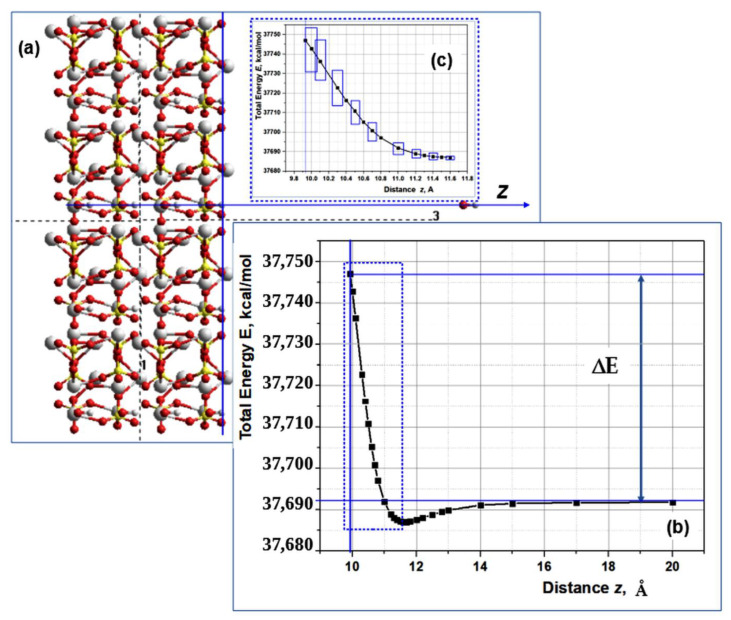
Figure 8.
Model of OH going out from HAP32 and change of the system total energy: (a) the distance z is along c-axis of the HAP32 cluster model, which is shown as axis number 3 (it is perpendicular to the surface plane of the HAP32 cluster); axis number 1 is along a-axis of the HAP32 model; axis number 2 is along b-axis of the HAP32 cluster (it is perpendicular to the image plane); (b) the graph shows the profile of the change in the total energy of the systems as the OH ion moves away from the surface of the HAP32 cluster (an example of one typical calculation); (c) the inset shows the selected part (outlined by a blue rectangle with a short dashed line).

