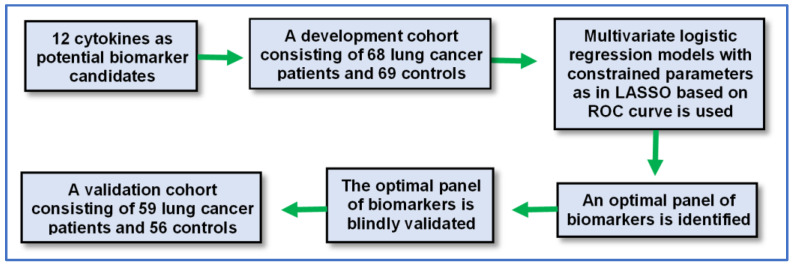
Figure 3.
Diagram of the study design and patient flow. The 12 plasma cytokines were analyzed in a discovery cohort. Data were analyzed using multi-variate logistic regression models with constrained parameters, as in least absolute shrinkage and selection operator (LASSO), based on receiver–operator characteristic (ROC) curve to identify an optimal panel of biomarkers. The identified biomarker panel was then validated in the validation cohort.

