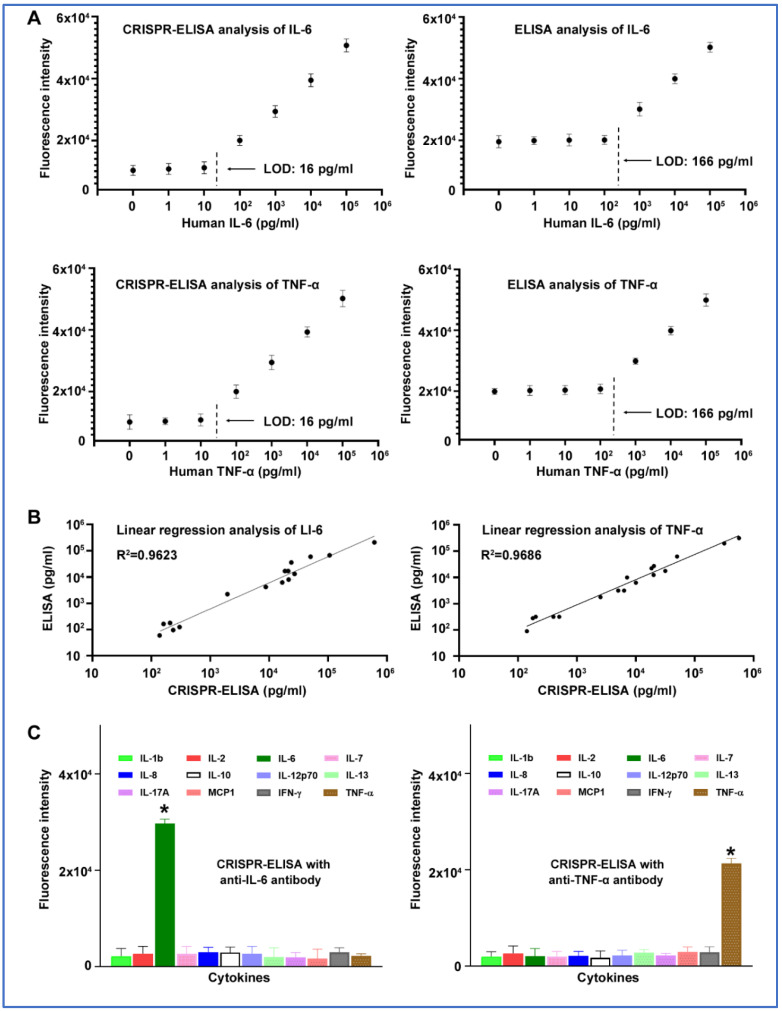
Figure 4.
Analytic performance of the CRISPR-ELISA assay. (A) The analytical sensitivity of the CRISPR-ELISA assay and conventional ELISA for the detection of IL-6 and TNF-α in serially diluted standard samples. Each concentration of the serially diluted sample was tested in triplicates for three times. (B) Consistency between the CRISPR-ELISA assay and conventional ELISA for the detection of IL-6 and TNF-α. A total of 20 plasma samples of lung cancer patients were evaluated by the two platforms in parallel. The results were compared using linear regression analysis. (C) The analytic specificity of the CRISPR-ELISA assay for detection of cytokines was determined in a panel of human cytokines. The results of the CRISPR-ELISA assay, represented by fluorescence intensity, were read by a fluorescence plate reader in 10 min. The X-axis shows the sample of each cytokine. The Y-axis indicates the fluorescence intensity of each sample. The error bars represent the standard deviation from the mean of the fluorescence intensity generated from triplicates per sample. * p < 0.0001.

