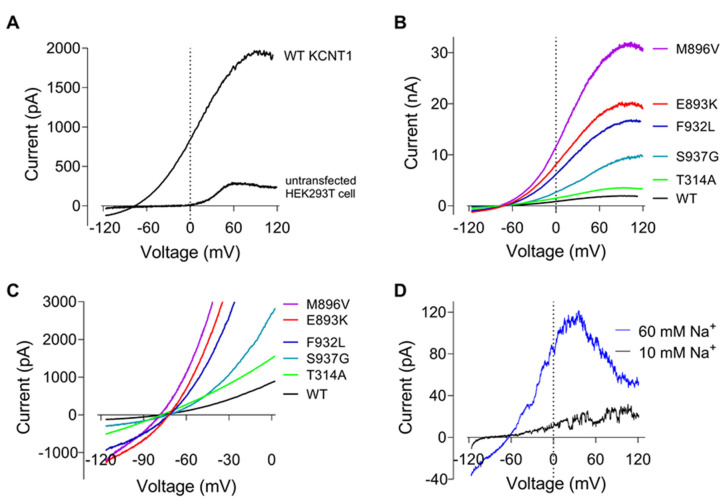
Figure 1.
Current-voltage plots of WT and mutant KCNT1 channels expressed in HEK293T cells. (A) I-V plots recorded in response to 100 ms ramps ranging from −120 to 120 mV in a cell transfected with WT KCNT1 and an untransfected cell. (B). Representative I-V plots of KCNT1 channels carrying GoF mutations. (C). The same data as on panel B, shown at a different scale. (D). WT KCNT1 currents recorded in inside-out patch in the presence of 10 mM or 60 mM intracellular Na+.

