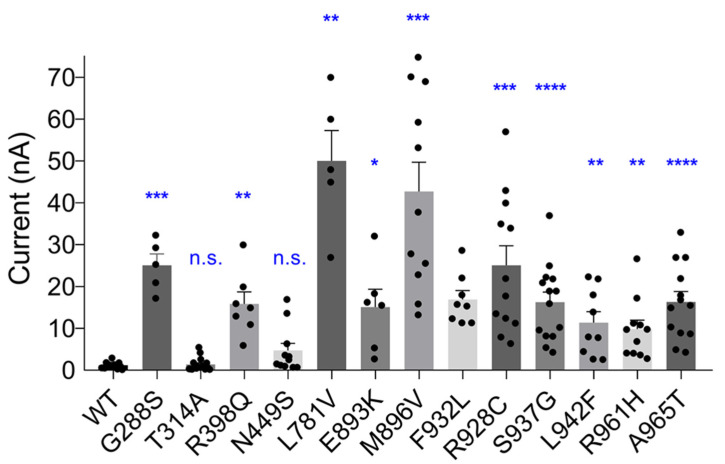
Figure 2.
The effect of GoF mutations on KCNT1 current amplitude. The average amplitudes of WT and GoF mutant KCNT1 currents, measured at +10 mV using I-V plots similar to those shown in Figure 1. Brown-Forsythe and Welch’s ANOVA tests with multiple comparisons produced significant difference between the amplitude of WT and each mutant current, except T314A and N449S. Calculated individual p values were as follows: G228S—0.0009; T314A—0.6136; R398Q—0.0022; N449S—0.0535; L781V—0.0026; E893K—0.0224; M896V—0.0001; F932L—0.0001; R928C—0.0004; S937G—<0.0001; L942F—0.0049; R961A—0.0024; A965T—<0.0001. The dots on the graph represent current amplitudes in individual cells; the asterisks denote the level of the significance (*—<0.05; **—<0.01; ***—<0.001; ****—<0.0001); n.s.—not significant. (Note: The amplitudes of the largest currents are underestimated due to a residual uncompensated series resistance. See Section 4).

