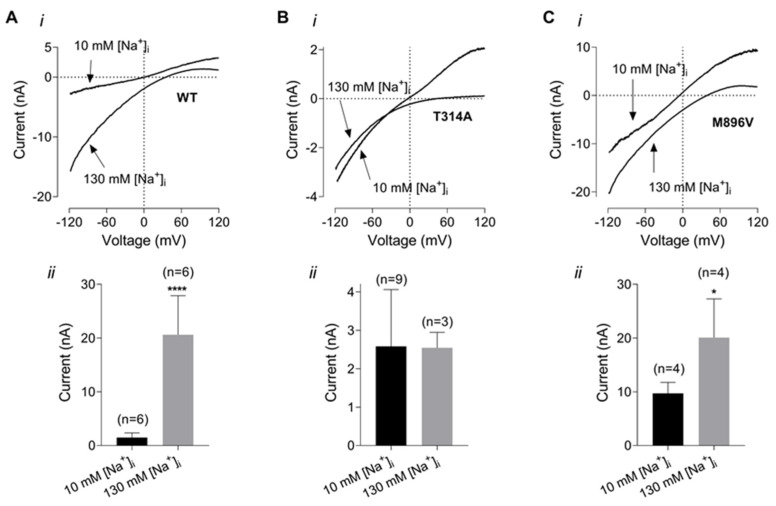
Figure 6.
Dependence of WT and mutant KCNT1 currents on intracellular Na+ concentration. (A). WT KCNT1. (B). T314A KCNT1. (C). M896V KCNT1. The I-V plots (i) were recorded in response to 100 ms voltage ramps from −120 mV to 120 mV in the bath solution with 130 mM K+ and using either control pipette solution or pipette solution with 130 mM K+ replaced with 130 mM Na+. The amplitudes of the inward K+ currents recorded at −100 mV using low (10 mM) and high (130 mM) intracellular Na+ are compared on the panels below (ii). *—<0.05; ****—<0.0001.

