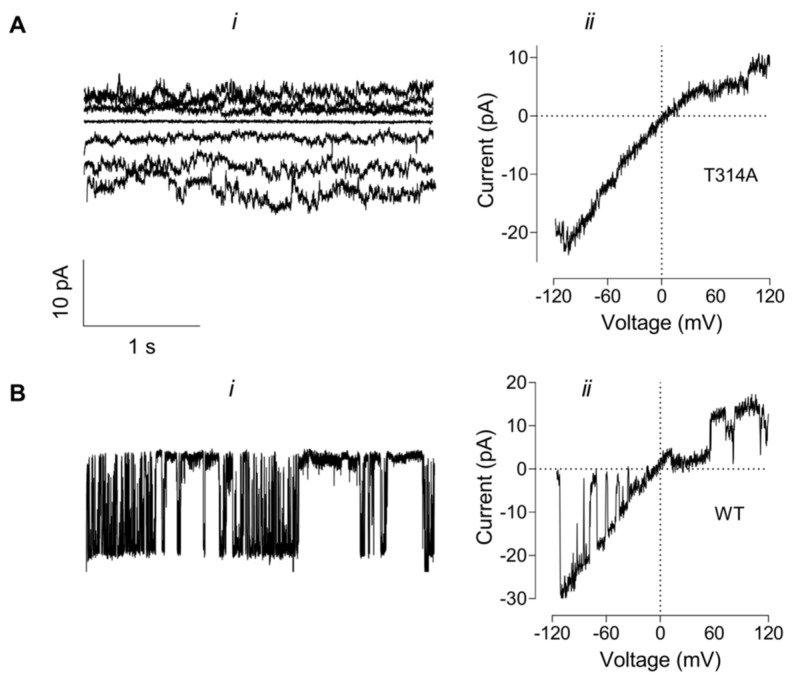
Figure 7.
Membrane currents recorded in inside-out patches from the cells expressing T314A or WT KCNT1. (A). T314A KCNT1 current traces recorded in response to 3 s voltage steps ranging from −60 mV to 60 mV (i) or a voltage ramp from −120 mV to 120 mV (ii). (B). WT KCNT1 current trace recorded in response to 3 s voltage step to −40 mV (i) or a voltage ramp from −120 mV to 120 mV (ii). All traces were recorded using symmetrical K+ (130 mM) and Na+ (20 mM) concentrations in the bath and the pipette solutions.

