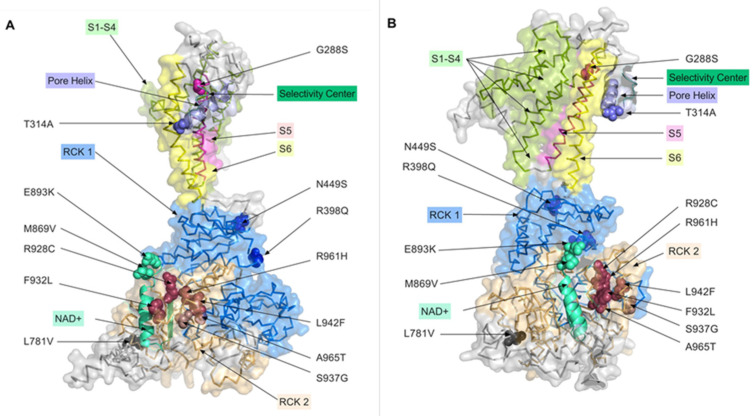
Figure 8.
Distribution of the studied mutations on the 3D model of the KCNT1 channel. Mutations analysed in this paper were mapped onto the 3D structure of the chicken KCNT1 homolog, Slo2_2 in the open conformation deposited in the rcsb.org Protein Data Bank (PDB, http://doi.org/10.2210/pdb5U70/pdb, accessed on 3 November 2022) [20,21], with colours corresponding to the functional domains they are located in (see Section 4). The projection of a single KCNT1 subunit shown in panel (B) is obtained by anticlockwise rotation of the projection shown in panel (A) by 90 degrees around the vertical axis.

