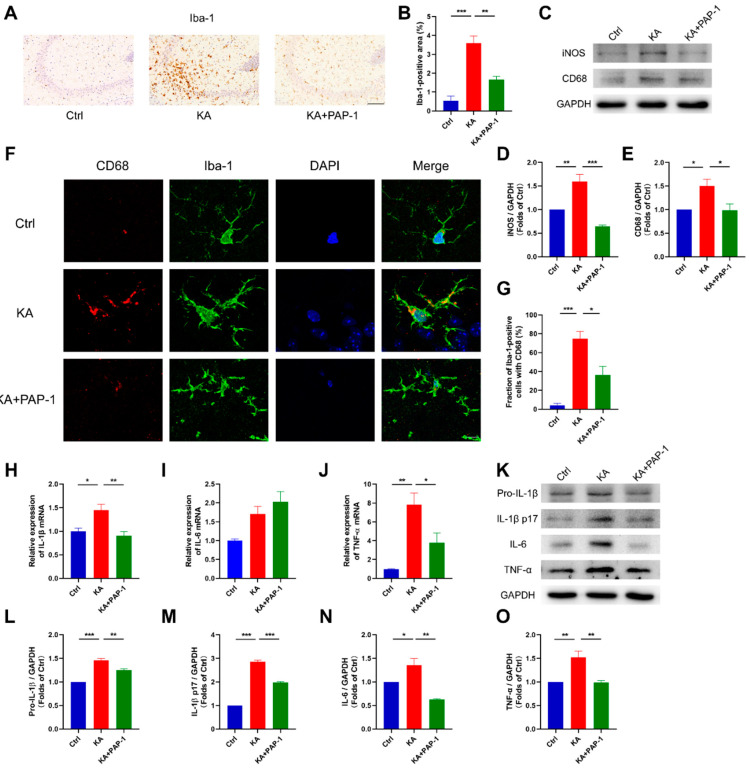
Figure 3.
PAP-1 reduced microglial activation and proinflammatory cytokine production in vivo. (A,B) Iba-1 staining of the hippocampal CA3 region (n = 3); statistics by one-way ANOVA with Tukey’s multiple comparisons test, F (2, 6) = 31.65, p = 0.0006. Scale bar: 100 μm. (C–E) Representative Western blot images and statistical analysis of iNOS and CD68 in the brain (n = 3); statistics by one-way ANOVA with Tukey’s multiple comparisons test; iNOS, F (2, 6) = 28.18, p = 0.0009; CD68, F (2, 6) = 6.829, p = 0.0284. (F,G) Representative confocal images of CD68/Iba-1/DAPI staining in the hippocampus and colocalization analysis of CD68 and Iba-1 (n = 3); statistics by one-way ANOVA with Tukey’s multiple comparisons test, F (2, 6) = 25.06, p = 0.0012. Scale bar: 10 μm. (H–J) Gene expression of IL-1β, IL-6, and TNF-α in the brain (n = 4 to 7 per group); statistics by one-way ANOVA with Tukey’s multiple comparisons test; IL-1β, F (2, 14) = 7.849, p = 0.0052; IL-6, F (2, 14) = 4.443, p = 0.0321; TNF-α, F (2, 14) = 9.470, p = 0.0025. (K–O) The protein levels of Pro-IL-1β, IL-1β p17, IL-6, and TNF-α in the brain were detected by Western blot (n = 3); statistics by one-way ANOVA with Tukey’s multiple comparisons test; Pro-IL-1β, F (2, 6) = 88.03, p < 0.0001; IL-1β p17, F (2, 6) = 320.3, p < 0.0001; IL-6, F (2, 6) = 20.46, p = 0.0021; TNF-α, F (2, 6) = 14.52, p = 0.0050. Data are depicted as the mean ± SEM. * p < 0.05, ** p < 0.01, *** p < 0.001.

