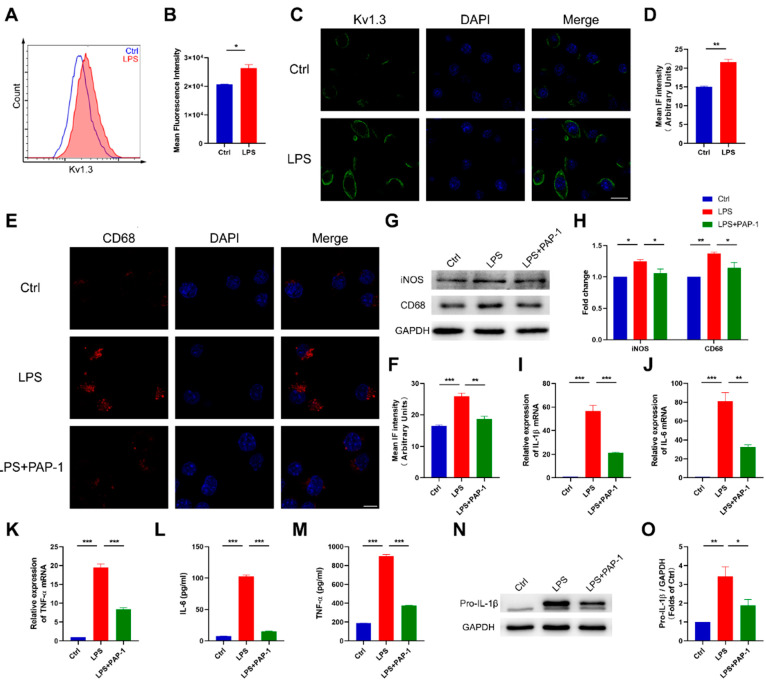
Figure 4.
PAP-1 reduced microglial activation and proinflammatory cytokine production in vitro. (A,B) Flow cytometric analysis of the surface expression of Kv1.3 in BV2 microglia (n = 3); statistics by unpaired t-test with Welch’s correction. (C,D) Immunofluorescence of LPS-induced Kv1.3 protein expression in BV2 microglia (n = 3); statistics by unpaired t-test. Scale bar: 20 μm. (E,F) Representative confocal images showing CD68 expression after treatment in BV2 microglia and statistical analysis (n = 3); statistics by one-way ANOVA with Tukey’s multiple comparisons test, F (2, 6) = 37.55, p = 0.0004. Scale bar: 10 μm. (G, H) Cell lysates were immunoblotted with iNOS and CD68 antibodies, and the results were summarized (n = 3); statistics by one-way ANOVA with Tukey’s multiple comparisons test; iNOS, F (2, 6) = 8.702, p = 0.0168; CD68, F (2, 6) = 13.01, p = 0.0066. (I–K) Gene expression of IL-1β, IL-6, and TNF-α in BV2 microglia after treatment (n = 3); statistics by one-way ANOVA with Tukey’s multiple comparisons test; IL-1β, F (2, 6) = 109.2, p < 0.0001; IL-6, F (2, 6) = 53.60, p = 0.0001; TNF-α, F (2, 6) = 258.6, p < 0.0001. (L,M) IL-6 and TNF-α in the supernatants of BV2 microglia were measured using ELISA (n = 3); statistics by one-way ANOVA with Tukey’s multiple comparisons test; IL-6, F (2, 6) = 50.41, p = 0.0002; TNF-α, F (2, 6) = 45.93, p = 0.0002. (N,O) Cell lysates were immunoblotted with IL-1β antibody, and the results were summarized (n = 3); statistics by one-way ANOVA with Tukey’s multiple comparisons test, F (2, 6) = 34.35, p = 0.0005. Data are depicted as the mean ± SEM. * p < 0.05, ** p < 0.01, *** p < 0.001.

