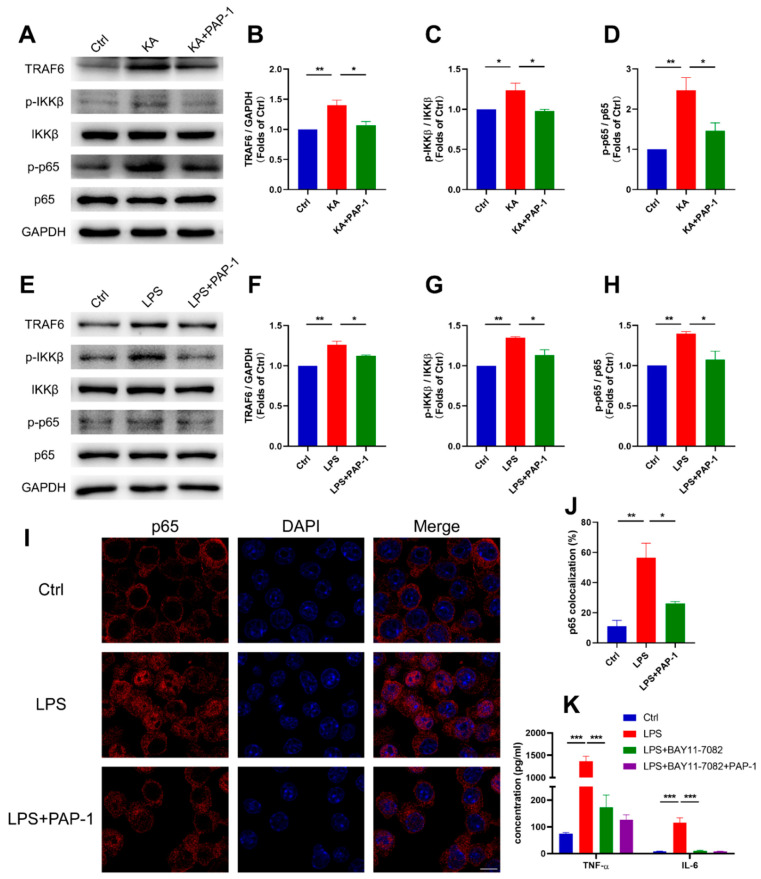
Figure 5.
Kv1.3 blockade inhibited KA/LPS-induced microglial activation through NF-κB signaling pathway. (A–D) Western blot analysis of TRAF6, p-IKKβ, IKKβ, p-p65, and p65 in the brain (n = 3); statistics by one-way ANOVA with Tukey’s multiple comparisons test; TRAF6, F (2, 6) = 13.87, p = 0.0056; p-IKKβ/IKKβ, F (2, 6) = 7.799, p = 0.0214; p-P65/P65, F (2, 6) = 12.54, p = 0.0072. (E–H) Western blot analysis of TRAF6, p-IKKβ, IKKβ, p-p65, and p65 in BV2 microglia (n = 3); statistics by one-way ANOVA with Tukey’s multiple comparisons test; TRAF6, F (2, 6) = 24.23, p = 0.0013; p-IKKβ/IKKβ, F (2, 6) = 20.38, p = 0.0021; p-P65/P65, F (2, 6) = 11.63, p = 0.0086. (I,J) The nuclear translocation analysis of p65 in BV2 microglia (n = 3); statistics by one-way ANOVA with Tukey’s multiple comparisons test, F (2, 6) = 15.02, p = 0.0046. Scale bar: 5 μm. (K) IL-6 and TNF-α in the supernatants of BV2 microglia were measured using ELISA (n = 3); statistics by one-way ANOVA with Tukey’s multiple comparisons test; IL-6, F (3, 8) = 34.01, p < 0.0001; TNF-α, F (3, 8) = 105.0, p < 0.0001. Data are depicted as the mean ± SEM. * p < 0.05, ** p < 0.01, *** p < 0.001.

