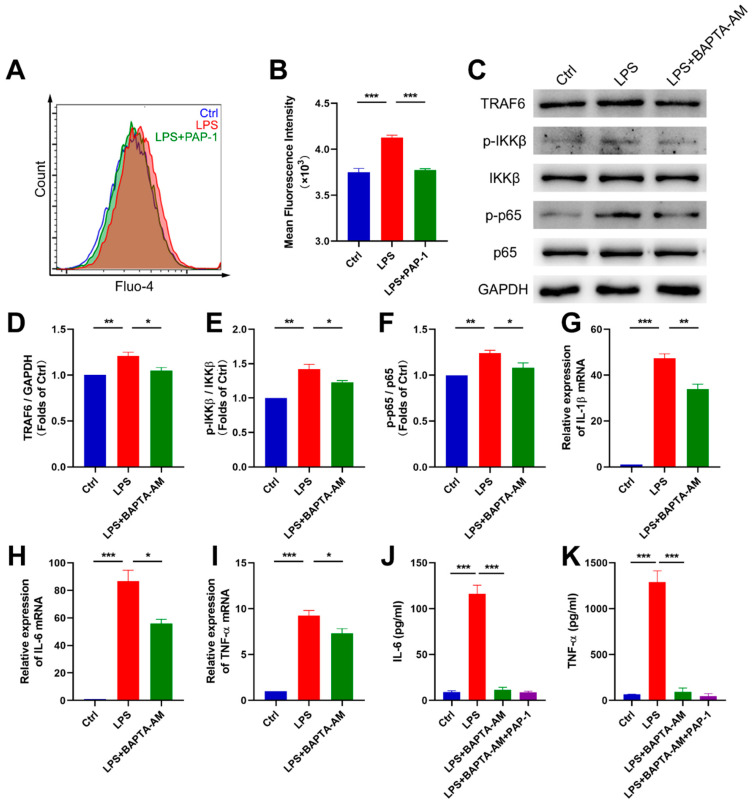
Figure 6.
Kv1.3 blockade downregulated the NF-κB pathway via Ca2+ signaling. (A,B) Flow cytometric analysis of the intracellular Ca2+ level in BV2 microglia (n = 3); statistics by one-way ANOVA with Tukey’s multiple comparisons test; F (2, 6) = 49.05, p = 0.0002. (C–F) Representative Western blot images and statistical analysis of the expression levels of NF-κB signaling pathway in BV2 microglia (n = 3); statistics by one-way ANOVA with Tukey’s multiple comparisons test; TRAF6, F (2, 6) = 12.87, p = 0.0068; p-IKKβ/IKKβ, F (2, 6) = 22.83, p = 0.0016; p-P65/P65, F (2, 6) = 12.08, p = 0.0079. (G–I) Gene expression of IL-1β, IL-6 and TNF-α in BV2 microglia (n = 3); statistics by one-way ANOVA with Tukey’s multiple comparisons test; IL-1β, F (2, 6) = 193.5, p < 0.0001; IL-6, F (2, 6) = 77.72, p < 0.0001; TNF-α, F (2, 6) = 96.72, p < 0.0001. (J,K) IL-6 and TNF-α in the supernatants of BV2 microglia were measured using ELISA (n = 3); statistics by one-way ANOVA with Tukey’s multiple comparisons test; IL-6, F (3, 8) = 111.1, p < 0.0001; TNF-α, F (3, 8) = 85.29, p < 0.0001. Data are depicted as the mean ± SEM. * p < 0.05, ** p < 0.01, *** p < 0.001.

