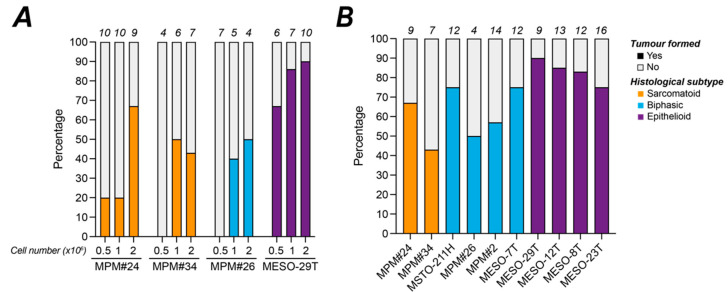
Figure 3.
Efficiency of MPM cell line engraftment on the CAM. (A,B) Stacked histograms show the percentage of viable eggs at E14 where tumour nodules had engrafted. (A) Experimental determination of the optimal cell number for im plantation on the CAM for 4 cell lines; (B) Engraftment efficiency for the 10 MPM cell lines implanted with 2 million cells; supporting survival data in Table S1. The number of viable engrafted eggs at E14 for each cell line is shown above the bars on each graph. All experiments were in ovo.

