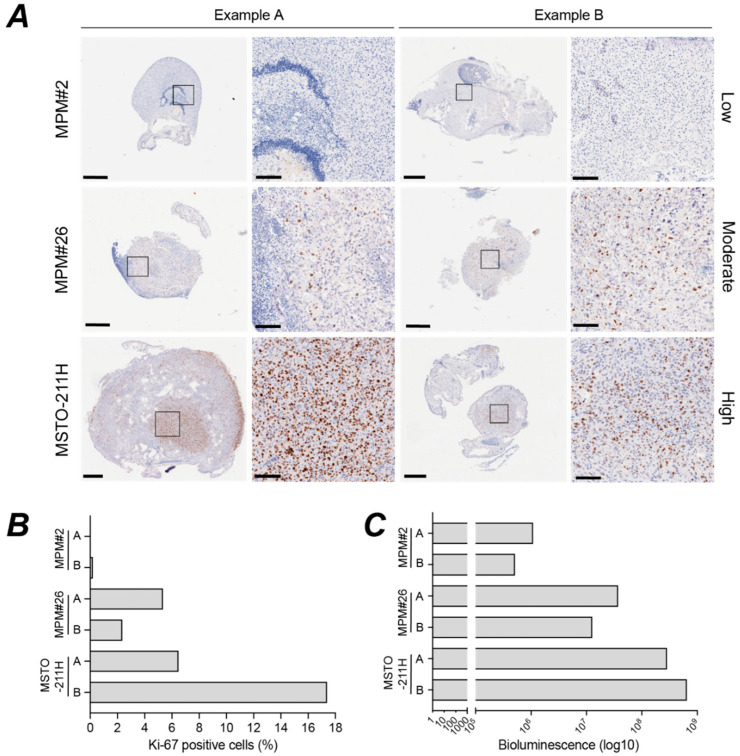
Figure 9.
Bioluminescence signal corresponds closely with Ki-67 staining for proliferating cells. (A) Ki-67 staining of two independent MPM nodules for each of three MPM cell lines chosen as examples of low, moderate, and high staining. Whole tumour nodules (left, scale bar 500 µm) and higher magnification of regions (right, scale bar 100 µm). Supporting IHC for other markers in Figure S8. (B) Ki-67 score determined by Qupath analysis of images show in A (n = 2). Supporting data in Figure S9A. (C) Corresponding bioluminescence signal for the tumours shown in A (n = 2). Pearson correlation between Ki-67 score and bioluminescence, r = 0.96, p = 0.0023. Supporting data in Figure S9B. All experiments were in ovo.

