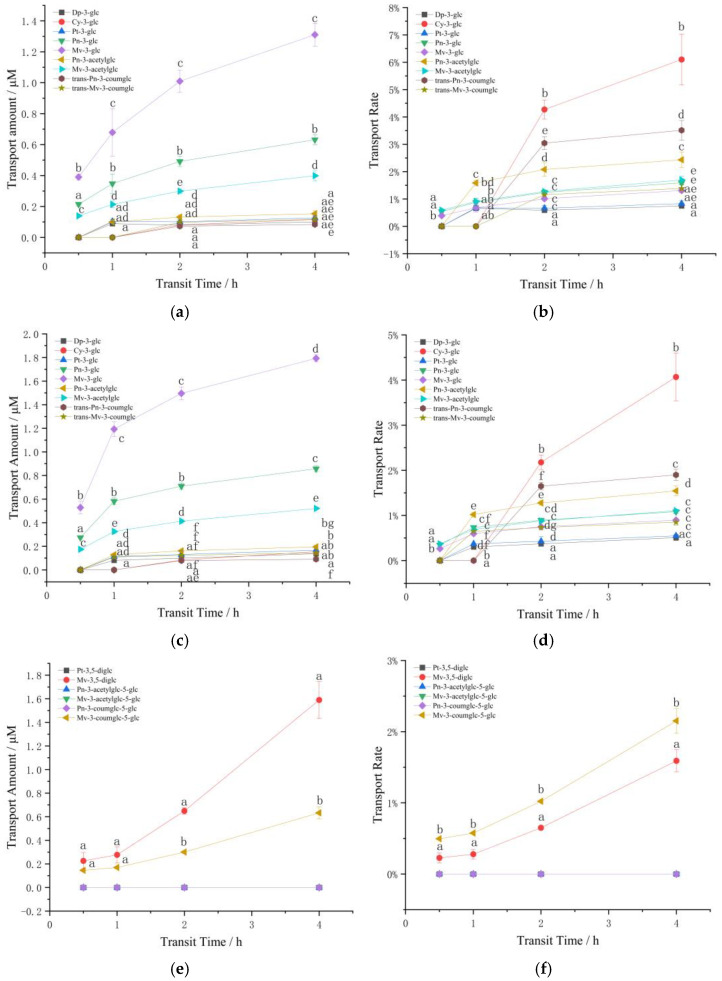
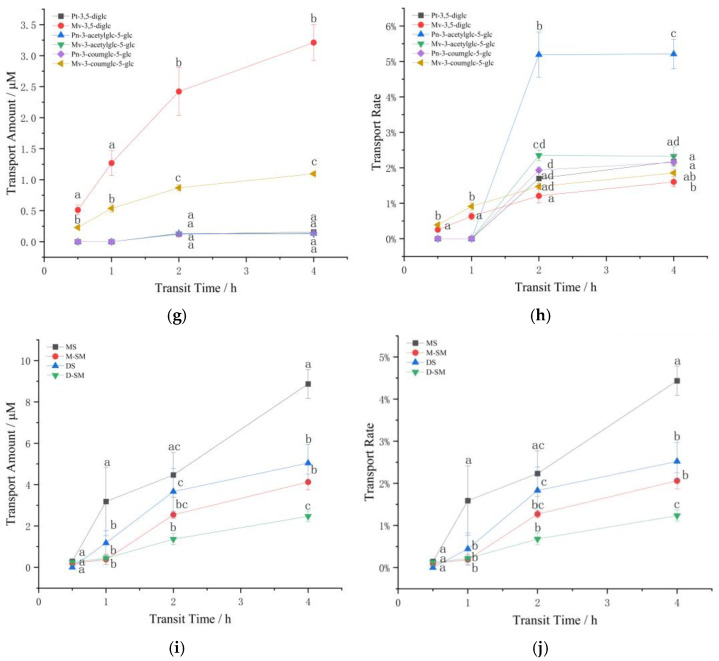
Figure 2.
Changes in the transport amount and transport rate of the anthocyanins. (a) The transport amount of 100 μM monoglycoside mixture; (b) The transport rate of 100 μM monoglycoside mixture; (c) The transport amount of 200 μM monoglycoside mixture; (d) The transport rate of 200 μM monoglycoside mixture; (e) The transport amount of 100 μM disaccharide mixture; (f) The transport rate of 100 μM disaccharide mixture; (g) The transport amount of 200 μM disaccharide mixture; (h) The transport rate of 200 μM disaccharide mixture; (i) The transport amounts of standard anthocyanins; (j) The transport rate of standard anthocyanins. Different small letters indicate significant difference at p < 0.05 in each figure. MS: monoglycoside standard; DS: diglycoside standard; M-: the transport information of monoglycosides; D-: the transport information of diglycosides; SM: standard mixture of monoglycoside and diglycoside.


