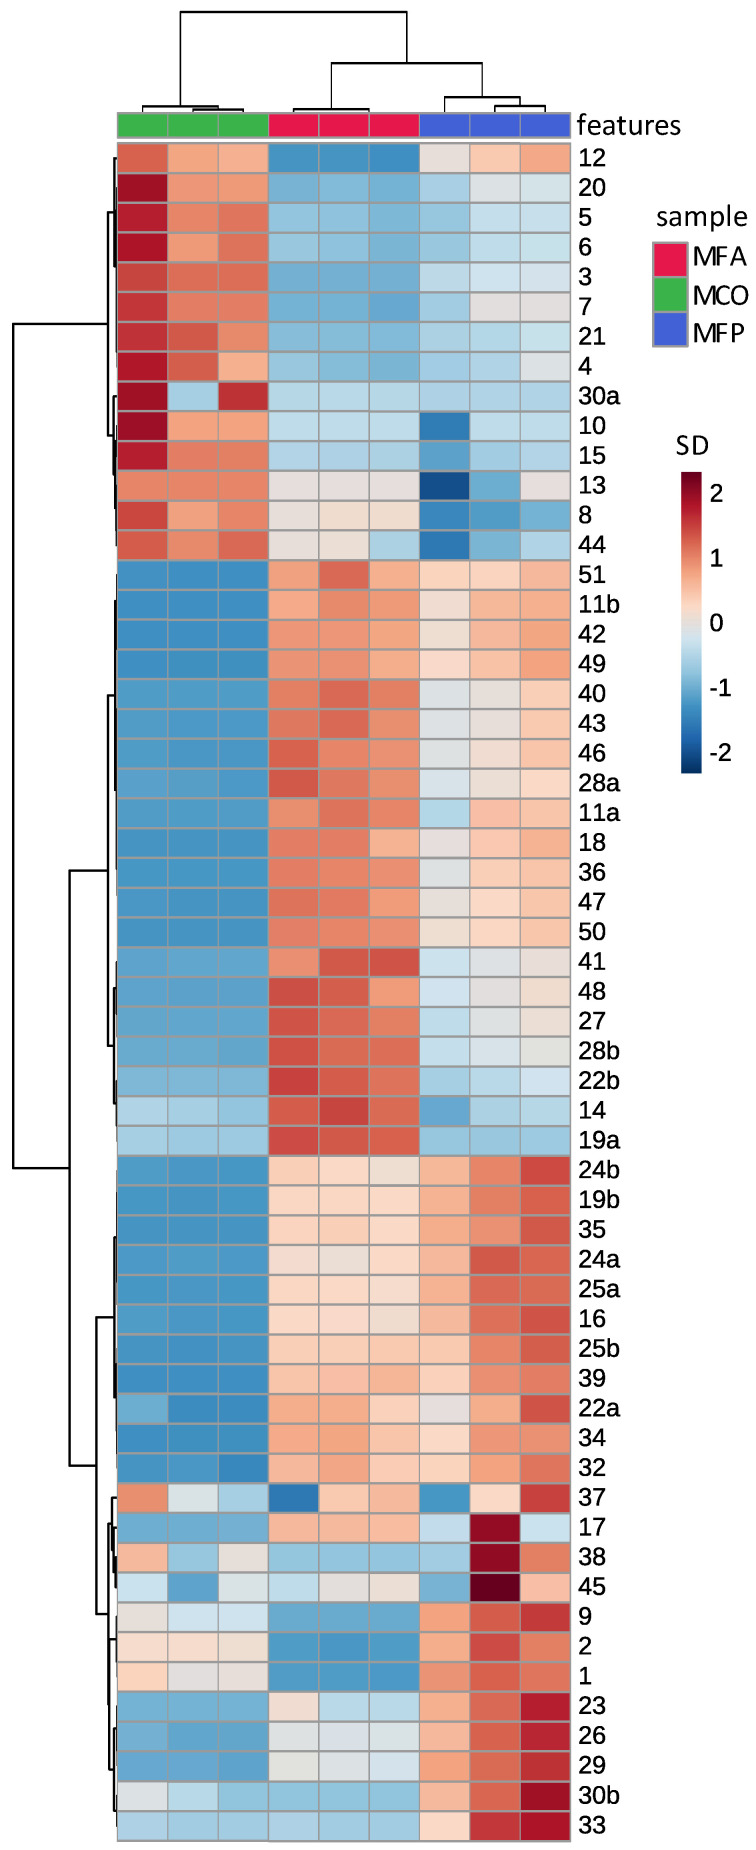
Figure 3.
Clustergram derived from the area ratio of the phytochemicals estimated from the LC-MS/MS analysis of triplicate methanolic extracts of three types of kawakawa. Each row represents a resolved feature (Table 2) and each column represents one triplicate analysis from the eight different leaf sources. Heat scale units are standard deviations from the mean of all peaks for that feature. Hierarchical clustering on each axis demonstrates similarity of features (y axis) and samples (x axis). The first letter of the sample label indicates methanolic, the second letter commercial dried leaves (C) or fresh leaves (F) and the third the source as listed in Table 1.

