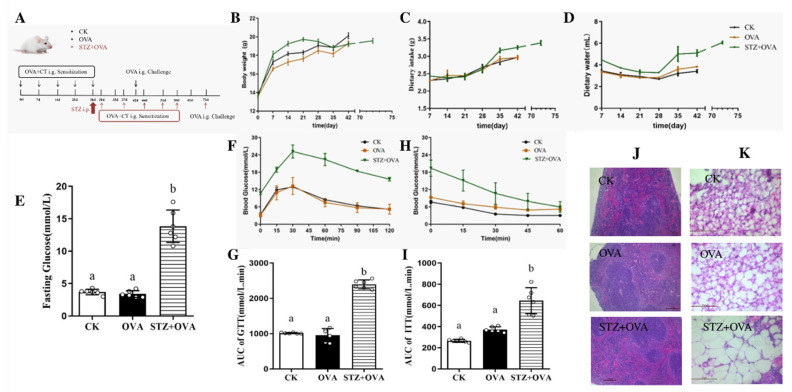
Figure 1.
Establishment of diabetic allergy (STZ + OVA) mice model. (A), schematic figure of the effect of diabetes on food allergy: mice were divided into CK, OVA, and STZ + OVA group mice. OVA group mice were given OVA and CT on day 0, 7, 14, 21, 28, and 42. The STZ+ OVA group mice were given STZ on day 28. On day 30, 37, 44, 51, 58, and 72, mice were given OVA and CT. i.g., intragastric. (B), Body weight. (C), Dietary intake. (D), Dietary water. (E), Fasting glucose. (F), Glucose tolerance. (G), Area under curve (AUC) of glucose tolerance. (H), Insulin tolerance. (I), AUC of insulin tolerance. (J), H&E staining of spleen (scale bar = 100 µm). (K), H&E staining of visceral adipose tissue (scale bar = 50 µm). The error bars indicated the mean ± SEM. n = 6. Different lowercase letters in the figure represent significant differences between the groups (p < 0.05 by one-way ANOVA followed by SNK).

