Figure 2.
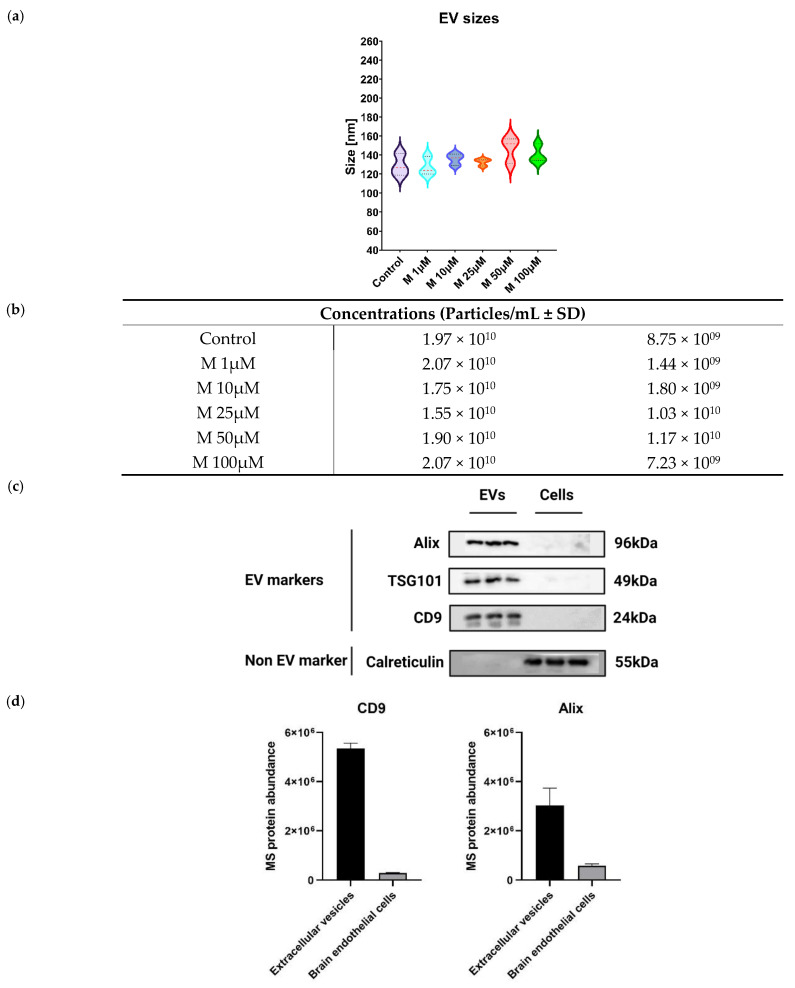
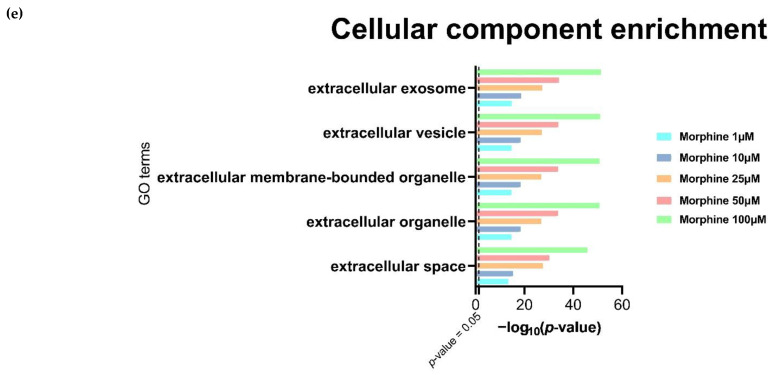
Characterization of extracellular vesicles isolated from human brain endothelial cells. (a) NTA measurement of EV sizes. Median ± SD, n = 3. (b) NTA measurement of EV concentration (particles/mL) of EVs. Mean ± SD, n = 3. (c) Western blots of EVs isolated by EVTRAP beads and brain endothelial cells lysate (cells). Alix, TSG101 and CD9 represent common EV markers. Calreticulin is an EV negative control, n = 3. (d) Mass spectrometry protein abundances of EV markers Alix and CD9. Mean ± SD, n = 3. (e) Gene Ontology term enrichment of EV quantified proteins provided by MetaCore™ software. X-axis corresponds to −log10(p-value), Y-axis corresponds to the gene ontology terms and the dot line represents the p-value cut-off of 0.05.


