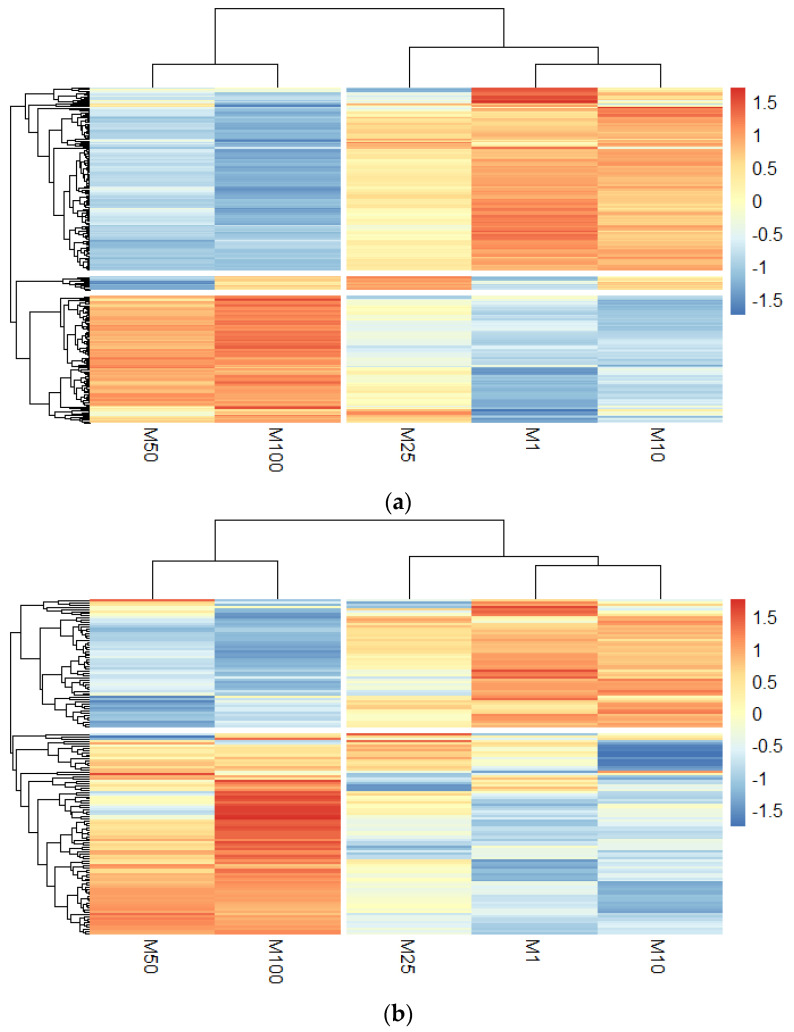
Figure 3.
Heatmaps. (a) Heatmap of differentally expressed proteins (DEPs) for each morphine treatment (1, 10, 25, 50 and 100 μM) in human brain endothelial cells and (b) in extracellular vesicles. Rows are clustered using euclidean distance and the clustering method used is complete. K-means clustering is set at 2.

