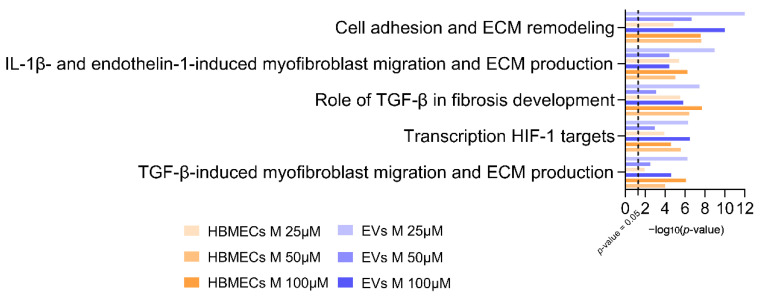
Figure 4.
Pathway enrichment analysis of modulated proteins in morphine-treated human brain endothelial cells and associated extracellular vesicles. Top five enriched pathways in both total cells and EVs upon 25, 50 and 100 μM of morphine for 24 h (|FC|> 1.2, p-value ≤ 0.05, n = 3). X-axis corresponds to −log10(p-value), Y-axis corresponds to the biological pathways and the dot line represents the p-value cut-off of 0.05. HBMECs = human brain microvascular endothelial cells, EVs = extracellular vesicles.

