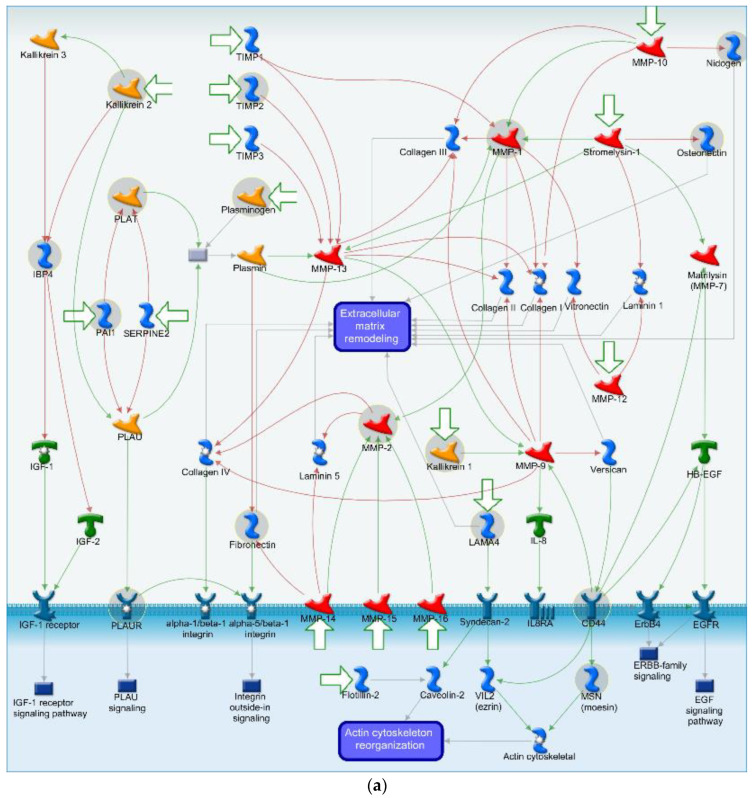
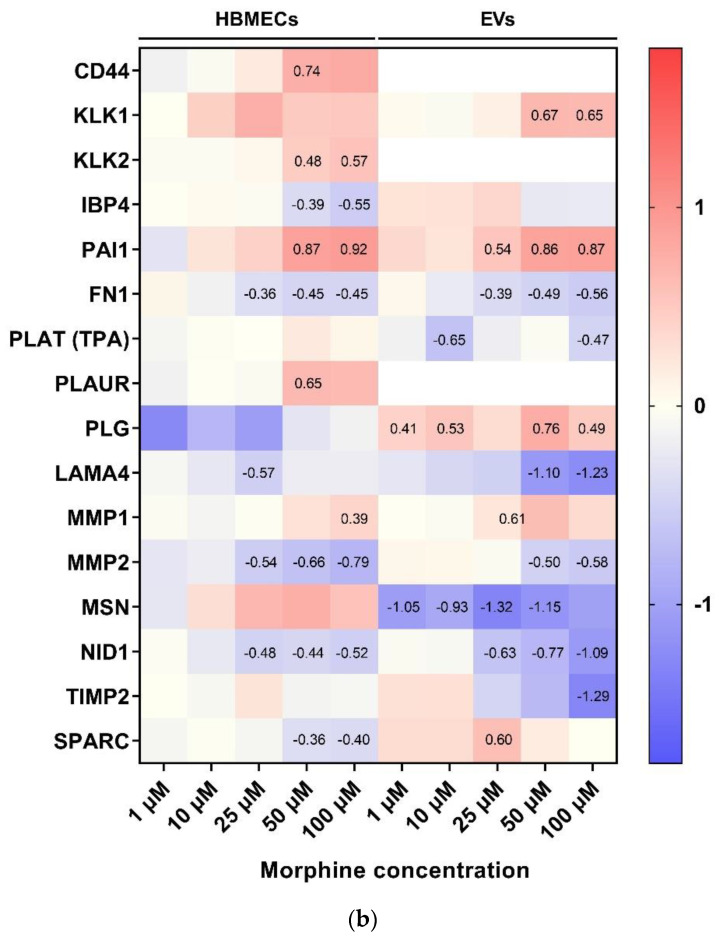
Figure 6.
Cell adhesion and extracellular matrix remodeling pathway map with associated heatmap representation of morphine-treated human brain endothelial cells and extracellular vesicles. (a) Pathway map of cell adhesion and extracellular matrix remodeling. Modulated proteins upon morphine treatment of HBMECs and associated EVs are presented in grey circles. Red lines represent inhibition/negative interactions, green lines represent activation/positive interactions and grey lines represent unspecified interactions. (b) Heatmap displaying DEPs associated to cell adhesion and extracellular matrix remodeling pathway. Color scale corresponds to log ratio of proteins. White color corresponds to unquantified proteins. Numbers in squares are log ratio of DEPs. HBMECs = human brain microvascular endothelial cells, EVs = extracellular vesicles.


