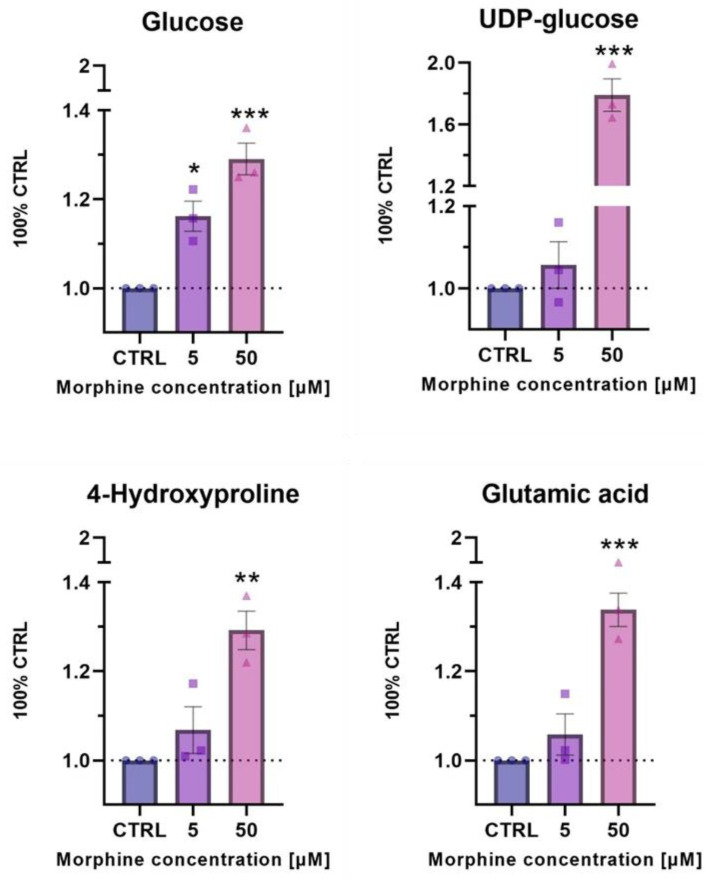
Figure 7.
Relative levels of metabolites involved in HIF1 target pathway (glucose and UDP-glucose) and ECM remodeling process (4-hydroxyproline and glutamic acid) after 24 h of exposure to morphine at 5 and 50 μM on HBMECs. Geometric shapes represents individual values. Statistical analysis for the morphine effects was evaluated with an unpaired t-test. Significant p-values: * p-value ≤ 0.05; ** p-value ≤ 0.01 and *** p-value ≤ 0.001.

