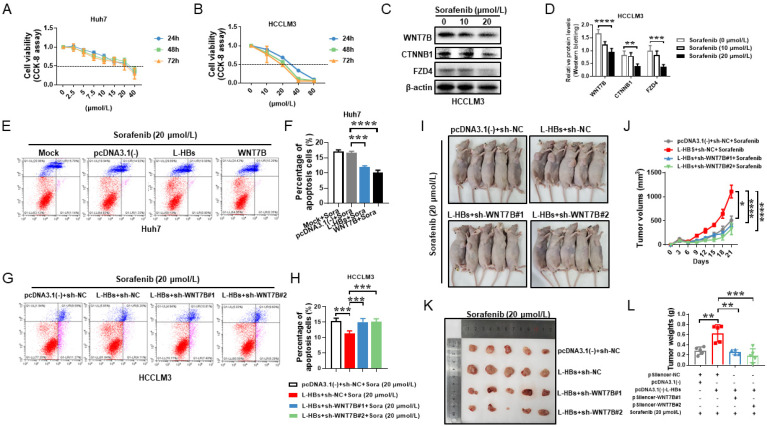
Figure 5.
Sorafenib resistance is mediated by large hepatitis B surface antigens (L-HBs) via WNT7B. (A,B) In Huh7 and HCCLM3, cell viability was evaluated using the CCK-8 assay after treatment with a variety of sorafenib doses. (C,D) WNT7B, CTNNB1, and FZD4 expression were detected in HCCLM3 cells after sorafenib treatment by Western blotting. The levels of expression were quantified and given as mean ± SD of at least three independent experiments. (E–H) Flow cytometry was used to assess cell apoptosis rates using Annexin V-FITC/propidium iodide. A total of 10,000 cells were counted per sample for apoptosis analysis. The ratios of apoptotic cells are represented as the mean ± SD of four independent experiments. (I,K) The graph depicts the development of xenograft tumors in nude mice. (J,L) The graph shows the mean ± SEM of tumor volume (I) and the mean ± SD of tumor weight (L) induced by indicated plasmids-transfected HCCLM3 cells of five independent experiments. * p < 0.05, ** p < 0.005, *** p < 0.001, **** p < 0.0001.

