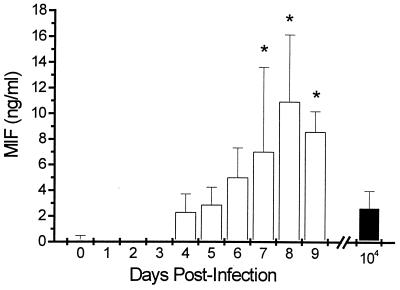
FIG. 4.
Serum concentration of MIF during P. chabaudi infection. Quantification of MIF was performed by using an MIF-specific sandwich ELISA as described in Materials and Methods. Each point represents the mean ± the SEM of three different experiments, each experiment performed in duplicate wells. The last column denotes a group of animals that were injected with 104 infected erythrocytes, a 100-fold-lower inoculum (solid bar). Values that are statistically different (P < 0.05) from day 4 postinfection are denoted by an asterisk.

