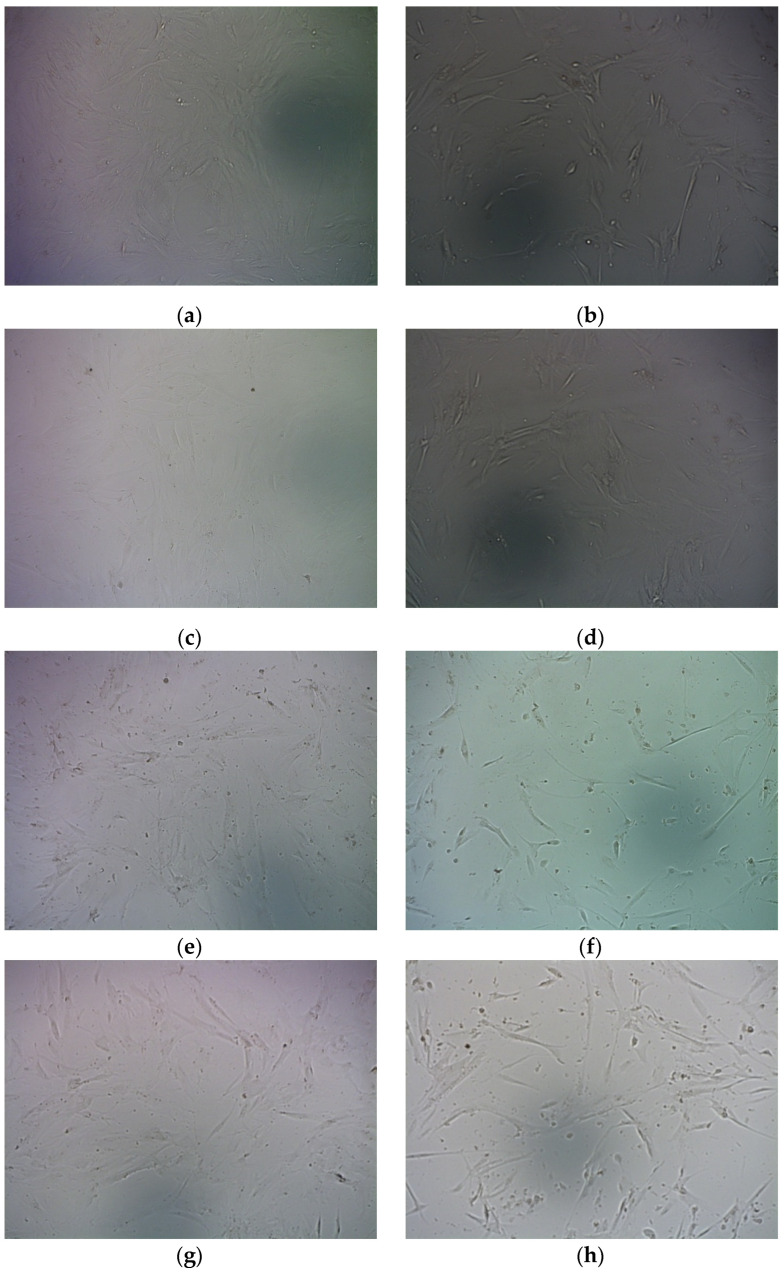
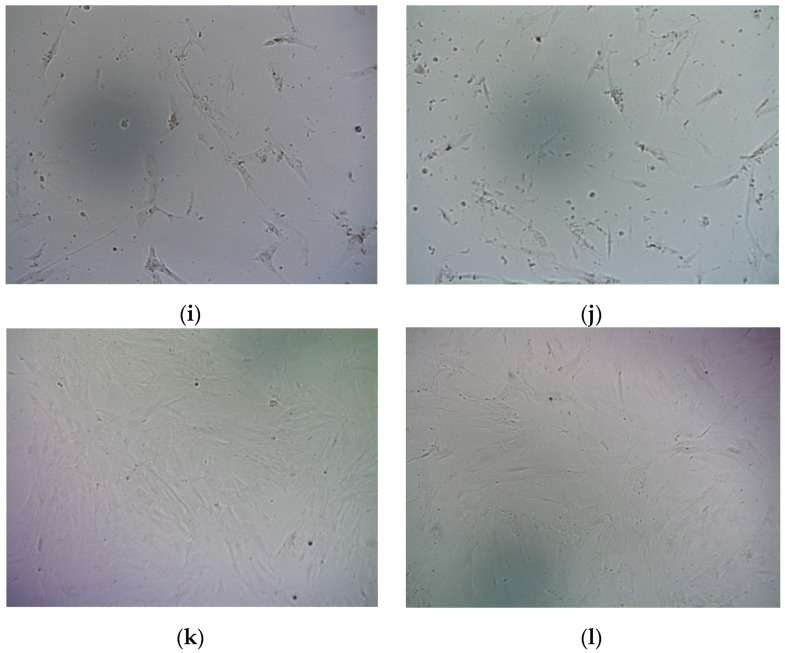
Figure 10.
Representative micrographs of UL cells in bright field undertaken 96 h after GCV treatment. (a,b)—RGD-R6-0,75 8/1 (0.7 µg DNA); (c,d)—RGD-R6-0,75 8/1 (0.35 µg DNA); (e,f)—RGD-R6-0,75 12/1 (0.7 µg DNA); (g,h)—RGD-R6-0,75 12/1 (0.35 µg DNA); (i,j)—PEI; (k)—intact cells; (l)—intact cells + ganciclovir. (a,c,e,g,i)—LacZ encoding plasmid; (b,d,f,h,j)—TK encoding plasmid.


