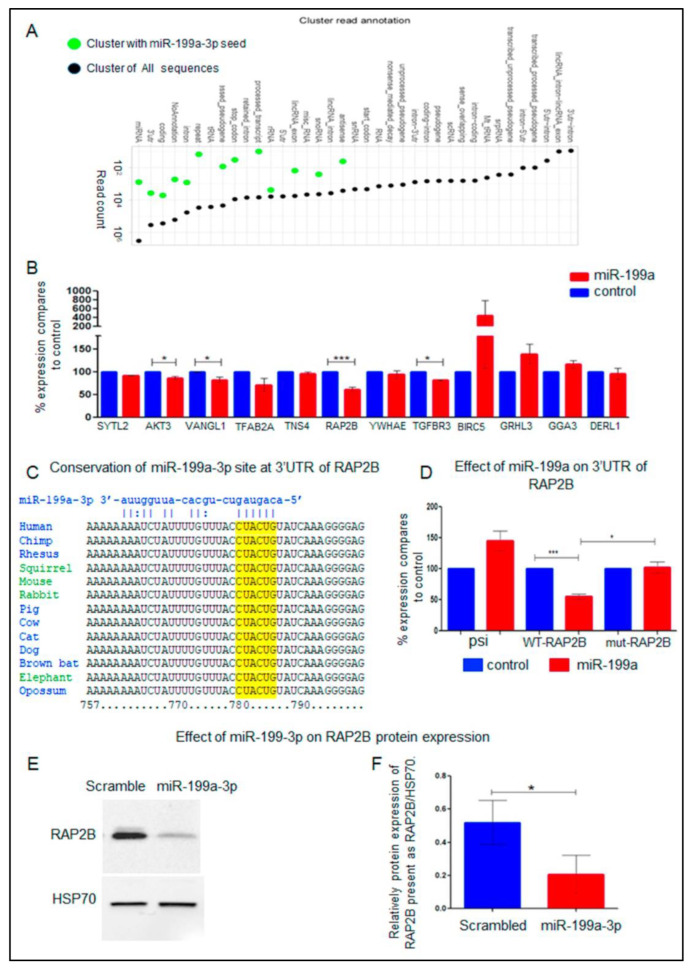
Figure 4.
Summary of PAR-CLIP Ago2 assay and RAP2B is a biochemical target of miR-199a-3p. (A) Genomic distribution of Argonaute 2 binding sites in transcript regions. Black = all cluster-assigned PAR-CLIP reads; Green = cluster-assigned PAR-CLIP reads containing miR-199a-3p complementary regions. RAP2B is a biochemical target of miR-199a-3p. (B) SCL-II cells stably expressing miR-199a (red columns) or control vector (blue columns) were transfected with psiCHECK-II vectors with 3′UTR of the named genes (fused to Renilla luciferase). 24 h after transfection cell lysates were subjected to a dual luciferase assay. The ratio of luminescence of renilla/firefly luciferase obtained in control cells for each gene was set as 100% and the results are the ratio of expression of renilla/firefly luciferase in cells expressing miR-199a-3p relative to controls. The mean ± SD was calculated from 3 independent experiments. Statistics were performed with t-tests * p < 0.05, *** p < 0.001. (C) The conservation of a RAP2B 3′UTR region that contains a putative miR-199a-3p binding site and was pulled down in the PAR-CLIP assay is shown in mammals. (D) SCL-II cells stably expressing miR-199a-3p (red columns) or control vector (blue columns) were transfected with psiCHECK-II (psi columns) or with a psiCHECK-II vector with WT or mutated 3′UTR of RAP2B fused to renilla luciferase (WT-RAP2B or MUT columns, respectively). The ratio of expression of renilla/firefly control cells was set as 100% and the results are the ratio of expression of renilla/firefly luciferase in cells expressing miR-199a-3p relative to it. The mean ± SD was calculated from 6 independent experiments. Statistics were performed with t-tests * p < 0.05, *** p < 0.001. (E) SCL-II cells were transfected with 10 nM of miR-199a-3p mimic RNA or with 10 nM of scrambled control RNA. WB analysis of the RAP2B protein is shown 48 h after transfection. (F) Bar plot presenting 3 independent densitometry measurements of the WB experiments shown in D. The data is the relative expression of RAP2B to Heat-Shock Protein 70 (HSP70). Statistics were performed using t-tests * p < 0.05.

