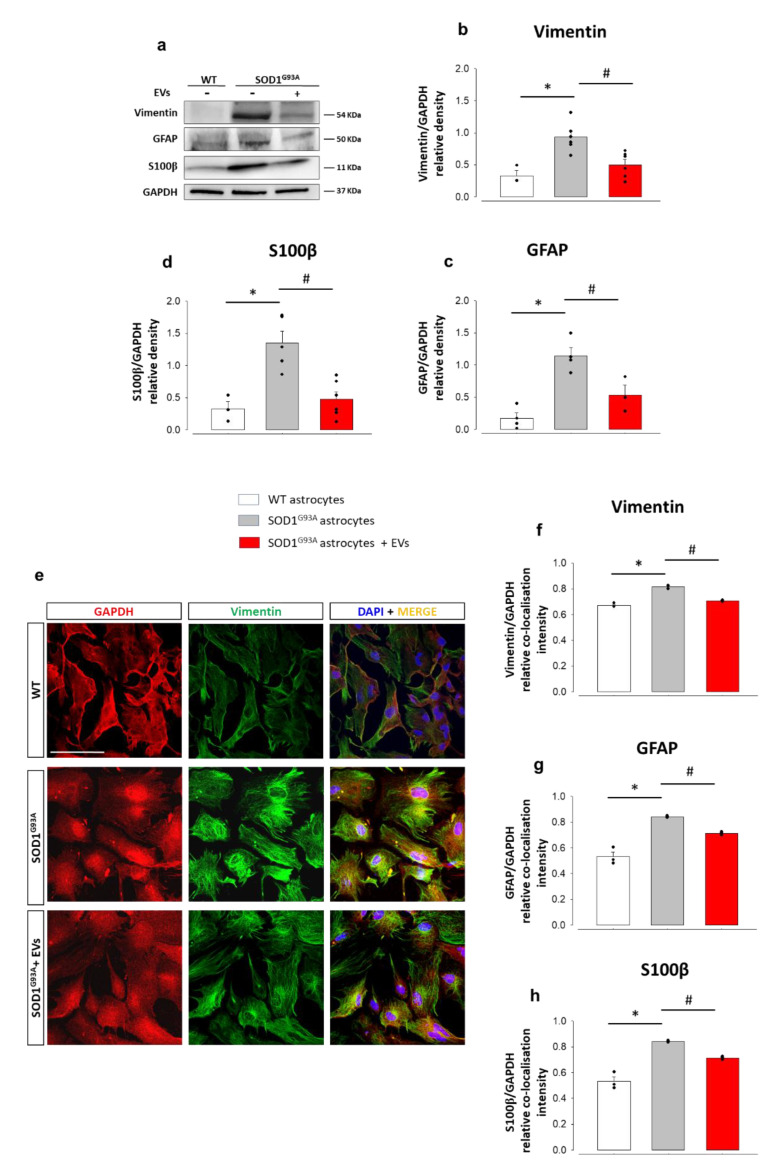
Figure 2.
MSC-derived EVs reduce astrogliosis in astrocytes from the spinal cords of adult SOD1G93Amice. (a) Representative Western blots (WB) of immunoreactive bands for vimentin, GFAP, and S100β; (b–d) quantitative representation of WB densitometric expression signals for (b) vimentin, (c) GFAP, and (d) S100β normalized to glyceraldehyde 3-phosphate dehydrogenase (GAPDH), as housekeeping protein, in WT astrocytes, untreated SOD1G93A astrocytes, and SOD1G93A astrocytes treated for 24 h with MSC-derived EVs. Vimentin, GFAP, and S100β expression are significantly increased in untreated SOD1G93A astrocytes vs. WT astrocytes (F(2,12) = 10.998, p = 0.004; F(2,8) = 17.903, p = 0.001; F(2,13) = 9.653, p = 0.005, respectively), while the exposure to EVs significantly reduces their expression (F(2,12) = 10.998, p = 0.01; F(2,8) = 17,903, p = 0.02; F(2,13) = 9.653, p = 0.01, respectively). Data are presented as means ± SEM of n = 3–6 independent experiments; statistical significance (* vs. WT and # vs. SOD1G93A astrocytes) for p < 0.05 at least (one-way ANOVA, followed by Bonferroni post hoc test). (e) Representative confocal microscopy immunocytochemical images for GAPDH (red fluorescence), vimentin (green fluorescence), an’ 4′,6-diamidin-2-fenilindolo (DAPI, blue fluorescence) in WT astrocytes, SOD1G93A astrocytes and EVs-treated SOD1G93A astrocytes. Scale bar: 100 µm. (f–h) Quantitative representation of protein expression was calculated as the relative fluorescence intensity of the protein of interest co-localized with the stable reference protein GAPDH. The quantitative analyses of the relative co-localization intensity of fluorescence correlated with the protein expression level were performed by calculating the Manders and Costes co-localization coefficients [58,59], and normalizing the results with respect to the fluorescence intensity of the stable housekeeping protein GAPDH. (f) Vimentin, (g) GFAP and (h) S100β expression are significantly increased in untreated SOD1G93A astrocytes vs. WT astrocytes [F(2,6) = 98.542, p < 0.001; F(2,6) = 47.483, p < 0.001; F(2,6) = 61.283, p < 0.001, for vimentin, GFAP, and S100β, respectively], while the exposure to MSC-derived EVs significantly reduces their expression [F(2,6) = 98.542, p < 0.001; F(2,6) = 47.483, p < 0.001; F(2,6) = 61.283, p < 0.02, for vimentin, GFAP and S100β, respectively]. Data are presented as means ± SEM of n = 3 independent experiments, run in triplicate; statistical significance for p < 0.05 at least (* vs. WT and # vs. SOD1G93A astrocytes; one-way ANOVA, followed by Bonferroni post hoc test).

