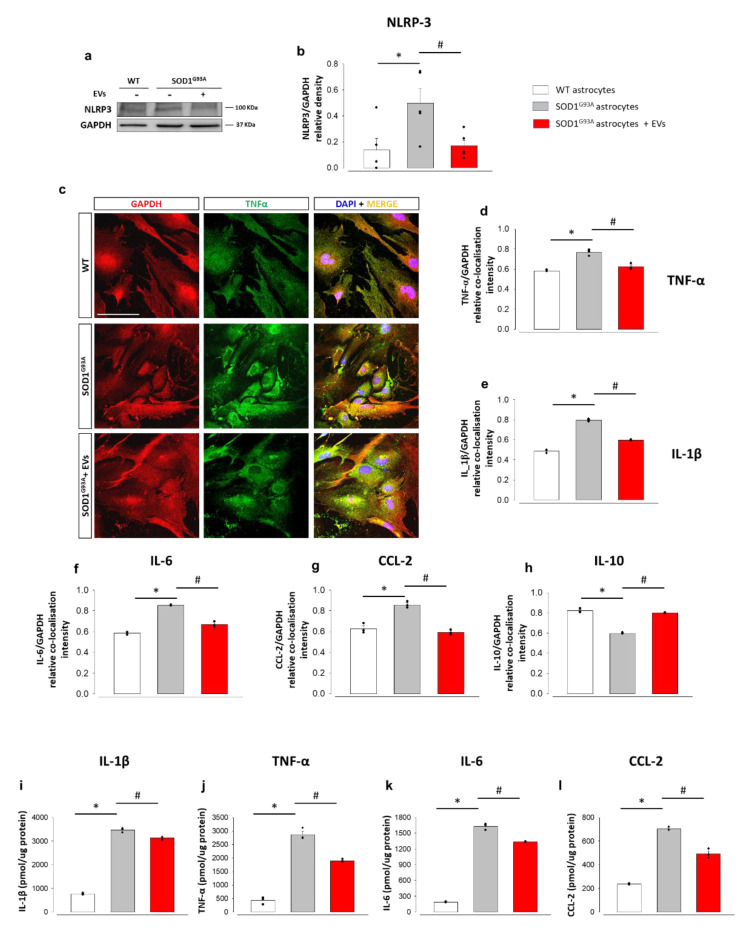
Figure 3.
MSC-derived EVs reduce NLRP3-inflammasome, and the expression and release of pro-inflammatory cytokines, in mouse astrocytes. (a) Representative WB immunoreactive bands for NLRP3 in WT astrocytes, SOD1G93A astrocytes and EV-treated SOD1G93A astrocytes. (b) Quantitative representation of NLRP3 expression, normalized to GAPDH. Data are presented as means ± SEM of n = 5 independent experiments; statistical significance for p < 0.05 (* vs. WT and # vs. SOD1G93A astrocytes; p = 0.008 vs. WT astrocytes; p = 0.02 vs. untreated SOD1G93A astrocytes; F(2,10) = 9.562; one-way ANOVA, followed by Bonferroni post hoc test). (c) Representative images for GAPDH (red fluorescence), TNF-α (green fluorescence), and DAPI (blue fluorescence), in WT astrocytes, SOD1G93A astrocytes and EV-treated SOD1G93A astrocytes. Scale bar: 100 µm. (d–h) Quantitative representation of fluorescence intensity (see legend to Figure 2 for details) for (d) TNF-α, (e) IL-1β, (f) IL-6, (g) CCL2, and (h) IL-10, in WT astrocytes, untreated SOD1G93A astrocytes and EV-treated SOD1G93A astrocytes. Data are presented as means ± SEM of n = 3 independent experiments, run in triplicate; statistical significance for p < 0.05 (* vs. WT and # vs. SOD1G93A astrocytes; F(2,6) = 40.686, p < 0.001; F(2,6) = 443.910, p < 0.001; F(2,6) = 174.847, p < 0.001; F(2,6) = 50.196, p < 0.001; F(2,6) = 256.549, p < 0.001 for TNF-α, IL-1β, IL-6, CCL2, and IL-10, respectively, in SOD1G93A vs. WT; astrocytes; p = 0.002, p < 0.001, p < 0.001, p < 0.001 and p < 0.001 for TNF-α, IL-1β, IL-6, CCL2, and IL-10, respectively, in EV-treated SOD1G93A vs. untreated SOD1G93A astrocytes; one-way ANOVA, followed by Bonferroni post hoc test). (i–l) ELISA quantification of cytokines (pmol/ug of proteins), for (i) IL-1β, (j) TNF-α, (k) IL-6 and (l) CCL2, in the conditioned media of WT, untreated SOD1G93A astrocytes, and EV-treated SOD1G93A astrocytes. Data are presented as means ± SEM of n = 3 independent experiments, run in triplicate; statistical significance for p < 0.05 (* vs. WT and # vs. SOD1G93A astrocytes; F(2,6) = 202.041, p < 0.001;F(2,6) = 1331.665, p < 0.001; F(2,6) = 1314.021, p < 0.001; F(2,6) = 269.710, p < 0.001, for TNF-α, IL-1β, IL-6 and CCL2, respectively, in SOD1G93A vs. WT astrocytes; p < 0.001, p = 0.003, p < 0.001, p < 0.001, for TNF-α, IL-1β, IL-6, and CCL2, respectively, in EVs-treated SOD1G93A vs. untreated SOD1G93A astrocytes; one-way ANOVA, followed by Bonferroni post hoc test).

