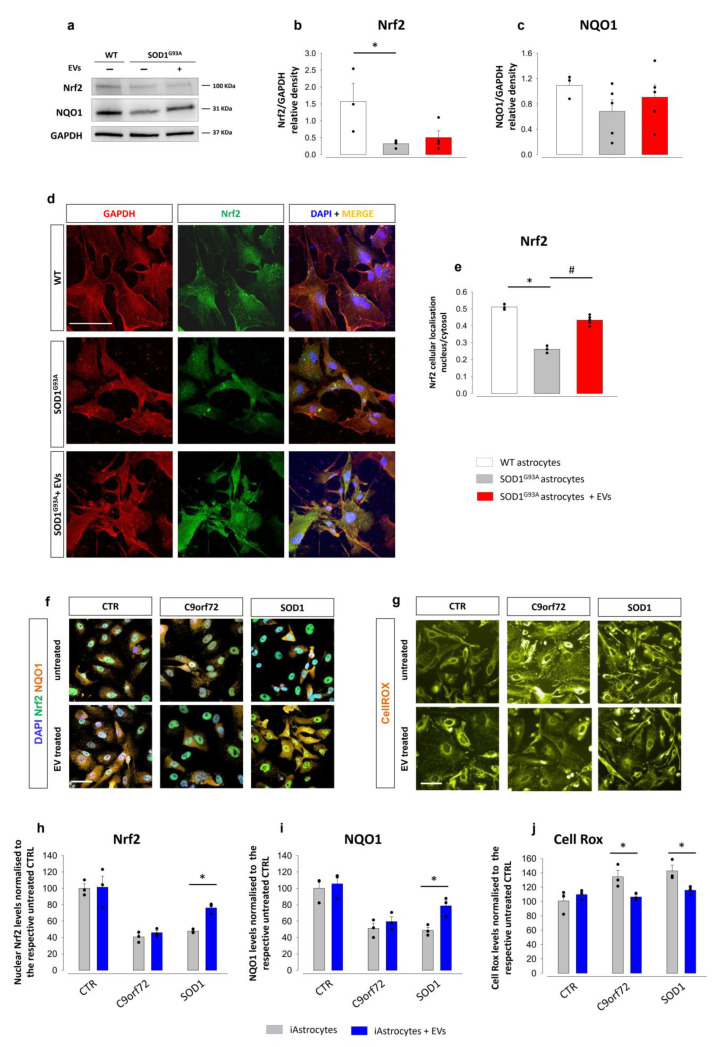
Figure 5.
MSc-derived EVs positively modulate the Nrf2-NQO1 antioxidant pathway in mouse SOD1G93A and patient-derived astrocytes. (a–e) Effect of MSC-derived EVs on oxidative stress in mouse SOD1G93A astrocytes. (a) Representative WB images for Nrf2 and NQO1 in WT astrocytes, SOD1G93A astrocytes and EV-treated SOD1G93A astrocytes. (b,c) Quantitative analyses of WB experiments for Nrf2 and NQO1. Data are presented as means ± SEM of n = 3–4 (referred to Nrf2) and n = 3–5 (referred to NQO1) independent experiments, run in triplicate; statistical significance for p < 0.05 (* p < 0.05 vs. WT; Nrf2 F(2,8) = 5.307; NQO1 F(2,9) = 0.716; one-way ANOVA, followed by Bonferroni post hoc test). (d) Representative confocal microscopy images for GAPDH (red fluorescence), Nrf2 (green fluorescence) and DAPI (blue fluorescence), in WT, SOD1G93A astrocytes and EV-treated SOD1G93A astrocytes. Scale bar: 100 µm. (e) Quantitative representation of fluorescence intensity related to the nucleus/cytosol cellular localization ratio. Data are presented as means ± SEM of n = 3–5 independent experiments, run in triplicate; statistical significance for p < 0.05 (* p < 0.001 vs. WT; # p< 0.001 vs. untreated SOD1G93A astrocytes; F(2,6) = 307.883; one-way ANOVA, followed by Bonferroni post hoc test). (f–j) Effect of MSC-derived EVs in human iAstrocytes. (f) Representative immunofluorescence images of Nrf2 (green fluorescence) and NQO1 (orange fluorescence) in untreated iAstrocytes and iAstrocytes exposed to human MSC-derived EVs. Scale bar: 100 µm. (g) Representative immunofluorescence images of reactive oxygen species stained with CellROX® probe (orange fluorescence) in controls (CTR), untreated iAstrocytes and iAstrocytes exposed to human MSC-derived EVs. Scale bar: 100 µm. (h) Quantification of fluorescence for total Nrf2 expression in controls (CTR), C9orf72, and SOD1 patients, treated or not with human MSC-derived EVs. (i) Quantification of fluorescence for total NQO1 expression. Data are expressed as means ± SEM of n = 3 independent experiments. Statistical significance for p < 0.05 (* p < 0.05 vs. untreated iAstrocytes; F(2,17) = 42.335 for Nrf2; F(2,17) = 26.163 for NQO1; two-way ANOVA with Sidak’s multi comparison test). (j) Quantitative analyses of reactive oxygen species stained with CellROX® probe, in controls (CTR), C9orf72, and SOD1 patients treated or not with EVs. Data are expressed as means ± SEM, n = 3 independent experiments, including two technical replicates per experiment. Statistical significance for p < 0.05 (* p < 0.05 vs. untreated iAstrocytes; F(2,17) = 6.605; two-way ANOVA with Sidak’s multi comparison test).

