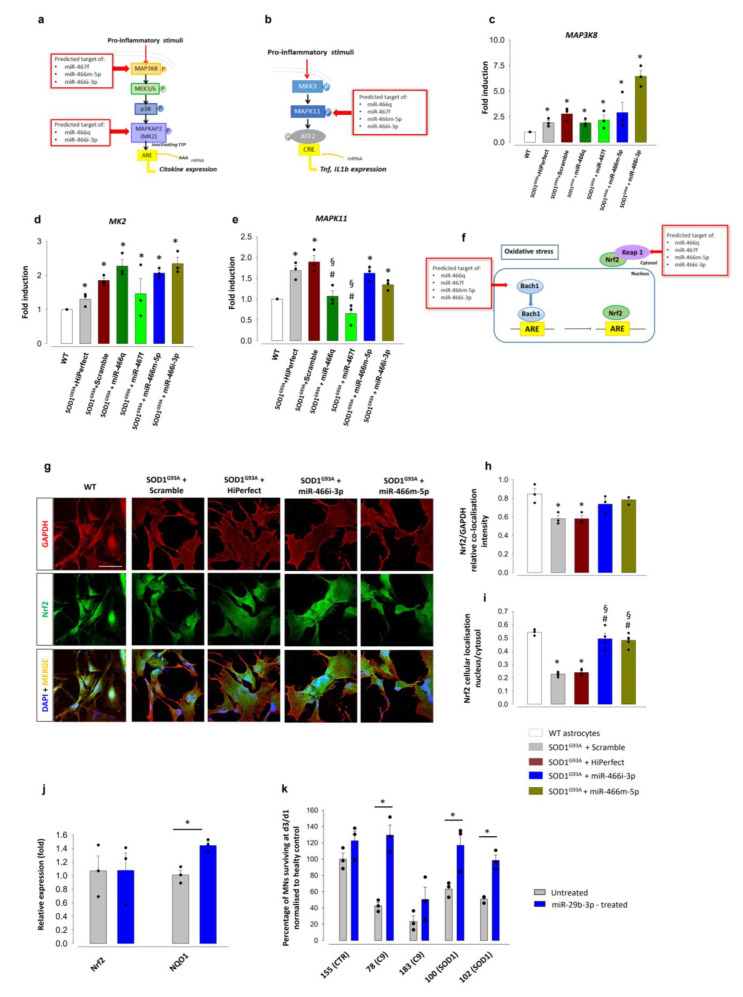
Figure 7.
EV-shuttled miRNAs modulate the pathological reactive phenotype, Nrf2 expression, and neurotoxicity in SOD1G93A astrocytes and iAstrocytes. Graphical representation of (a) MAP3K8/MK2, (b) MAPK11 and (f) Nrf2 pathways. RT-qPCR of (c) Map3k8, (d) Mapkapk2, and (e) Mapk11 expression in WT, SOD1G93A astrocytes + Hiperfect, SOD1G93A astrocytes + scrambled miRNAs, and SOD1G93A astrocytes + miRNAs. Data are presented as means ± SEM of n = 3 independent experiments, run in triplicate; statistical significance for p < 0.05 (* p < 0.05, vs. WT; # p < 0.01 vs. SOD1G93A astrocytes + Hiperfect; § p < 0.01 vs. SOD1G93A astrocytes + scrambled miRNA; F(6,14) = 11.738, F(6,14) = 6.321 and F(6,14) = 14.786 for Map3k8, Mapkapk2 and Mapk11, respectively; one-way ANOVA followed by Bonferroni post hoc test). (g) Representative images for GAPDH (red fluorescence), Nrf2 (green fluorescence) and DAPI (blue fluorescence), in WT, SOD1G93A astrocytes, and SOD1G93A astrocytes treated with miRNAs. Scale bar: 100 µm. (h,i) Quantitative representation of fluorescence intensity (see Figure 2) for (h) Nrf2 total expression and (i) Nrf2 cellular localization expressed as nuclear/cytoplasm ratio. Data are presented as means ± SEM of n = 3 independent experiments (referred to Nrf2 total expression) and n = 3–6 independent experiments (referred to Nrf2 cellular localization); statistical significance for p < 0.05 (* p < 0.001 vs. WT; # p < 0.001 vs. SOD1G93A astrocytes + HighPerfect; § p < 0.001 vs. SOD1G93A astrocytes + scrambled miRNA; Nrf2/GAPDH, F(4,10) = 7.507; Nrf2 nucleus/cytoplasm, F(4,10) = 214,640; two-way ANOVA followed by Bonferroni post hoc test). (j) RT-qPCR validation of Nrf2 and NQO1 expression in control iAstrocytes after miR-29b3P transfection. Data are presented as means ± SEM of n = 3 independent experiments; statistical significance for * p < 0.05 vs. control iAstrocytes (NQO1, t = −4.882; Nrf2, t = −0.0197; two-tailed Student’s t-test). (k) Quantification of MN survival expressed as the percentage of MNs with axon (calculated respect to the total number of MNs at day 1) after 3 days of co-culture with untreated iAstrocytes or iAstrocytes transfected with miRNA mimic miR-29b3P. Data are presented as means ± SEM of n = 3 biological replicates; statistical significance * p < 0.05 vs. untreated iAstrocytes; two-tailed Student’s t-test.

