
FIGURE 5.
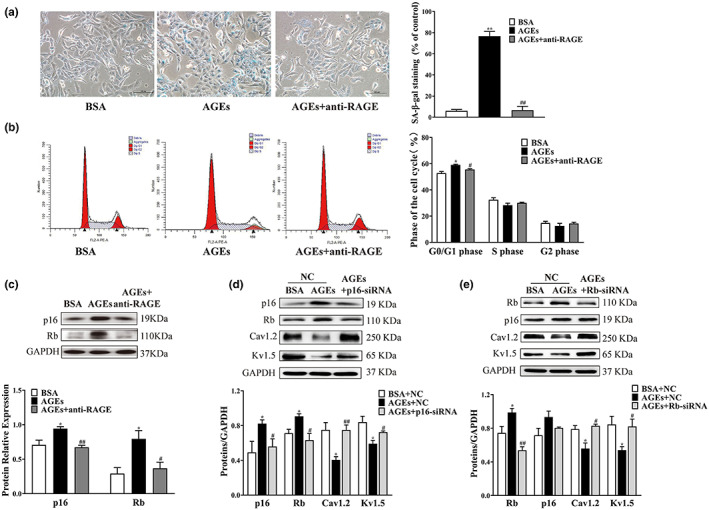
Alterations in senescence phenotype and expression levels of HL‐1 cells treated with AGEs, anti‐RAGE antibody, plasmid transfection. (a) SA‐β‐gal staining was used to elevate the positive rate of senescent cells treated with AGEs or anti‐RAGE antibody (n = 4). (b) Flow cytometry was used to detect cell cycle distribution in HL‐1 cells treated with AGEs or anti‐RAGE antibody (n = 4). (c) Representative blots and densitometry analysis of p16 and Rb proteins in HL‐1 cells treated with AGEs or anti‐RAGE antibody (n = 4). (d) Representative blots and densitometry analysis of Cav1.2 and Kv1.5 proteins in HL‐1 cells intervene with p16 protein (n = 3). (e) Representative blots and densitometry analysis of Cav1.2 and Kv1.5 proteins in HL‐1 cells intervene with Rb protein (n = 3–5). *p < 0.05, **p < 0.01 vs. BSA group or BSA + NC group. # p < 0.05, ## p < 0.01 vs. AGEs group or AGEs + NC group.