. 2022 Sep 30;21(12):e13724. doi: 10.1111/acel.13724
© 2022 The Authors. Aging Cell published by Anatomical Society and John Wiley & Sons Ltd.
This is an open access article under the terms of the http://creativecommons.org/licenses/by/4.0/ License, which permits use, distribution and reproduction in any medium, provided the original work is properly cited.
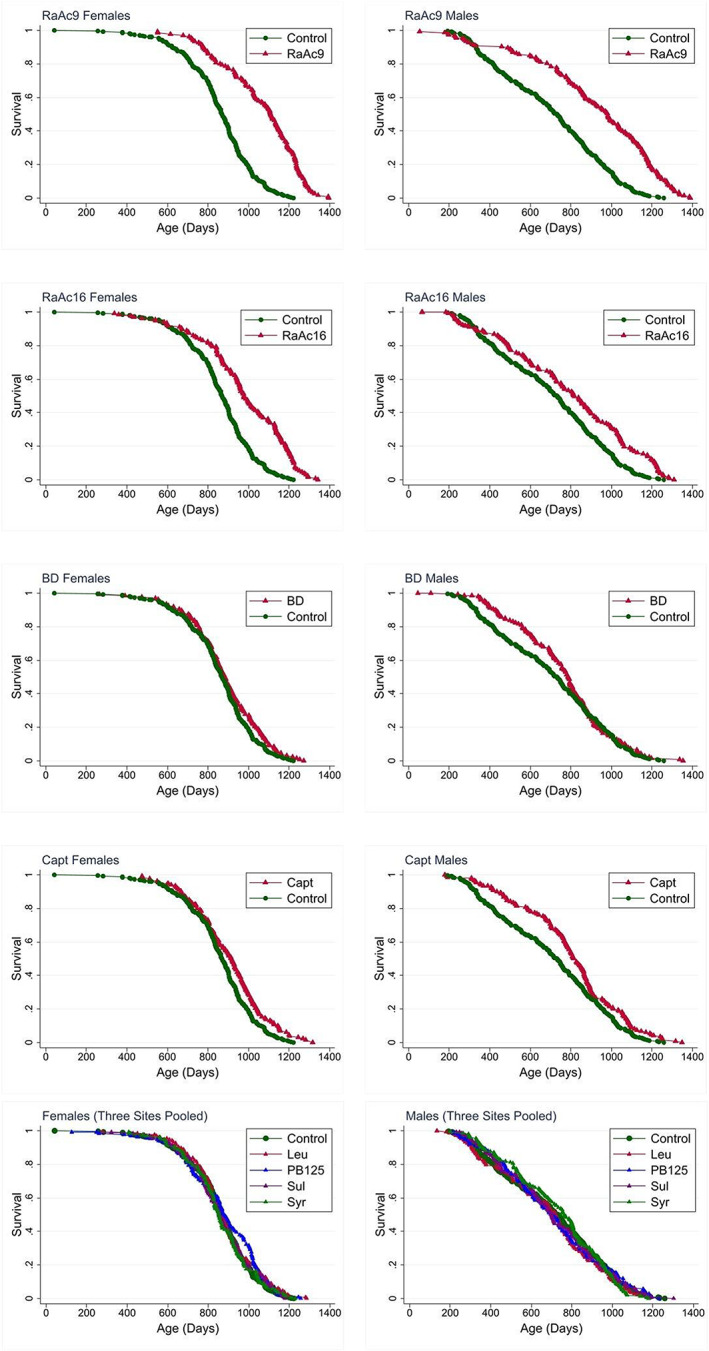
FIGURE 1.

Survival plots for data pooled from all three sites:
