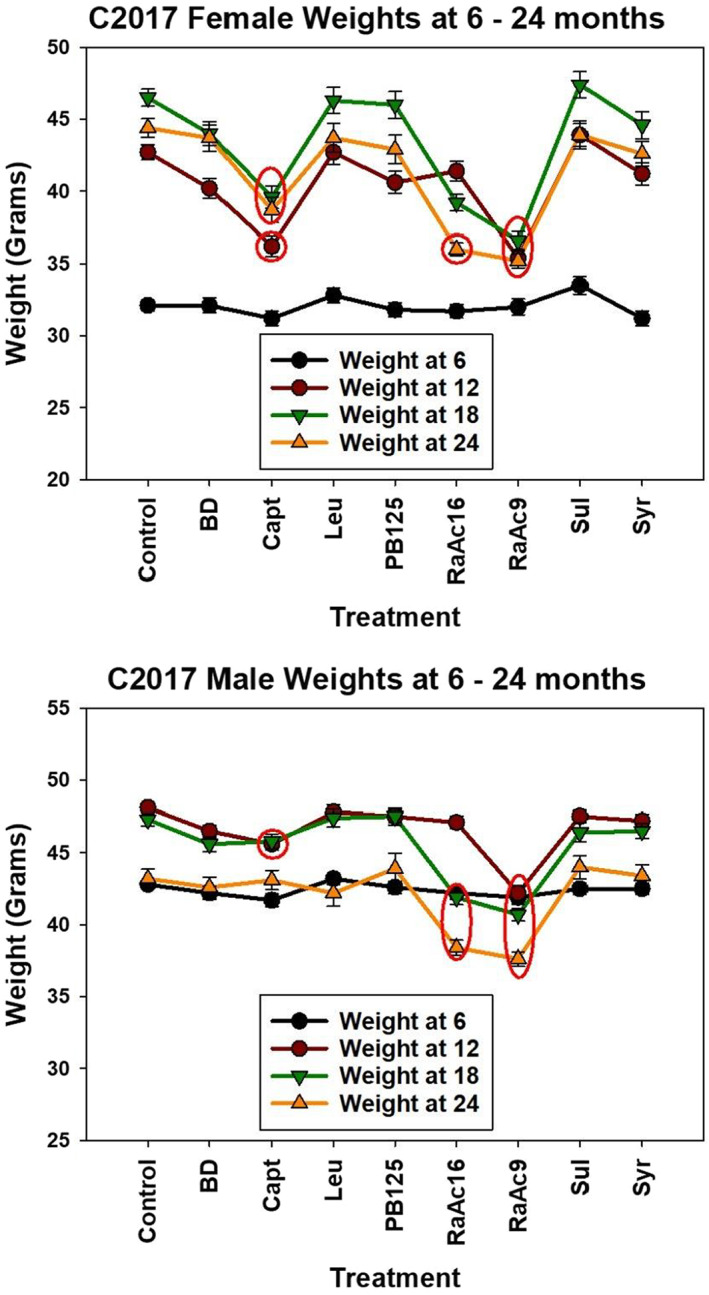
FIGURE 4.

Weights at 6–24 months for C2017 groups (TJL, UM, UT Pooled). Each symbol shows mean and SEM for weight, in grams, for the indicated group of mice, pooled over all three sites. Females are shown in the top panel and males at the bottom. Red ovals indicate groups for which mice in the drug‐treated group differed at p < 0.05 from age‐ and sex‐matched control mice by Tukey's postdoc test after one‐factor ANOVA.
