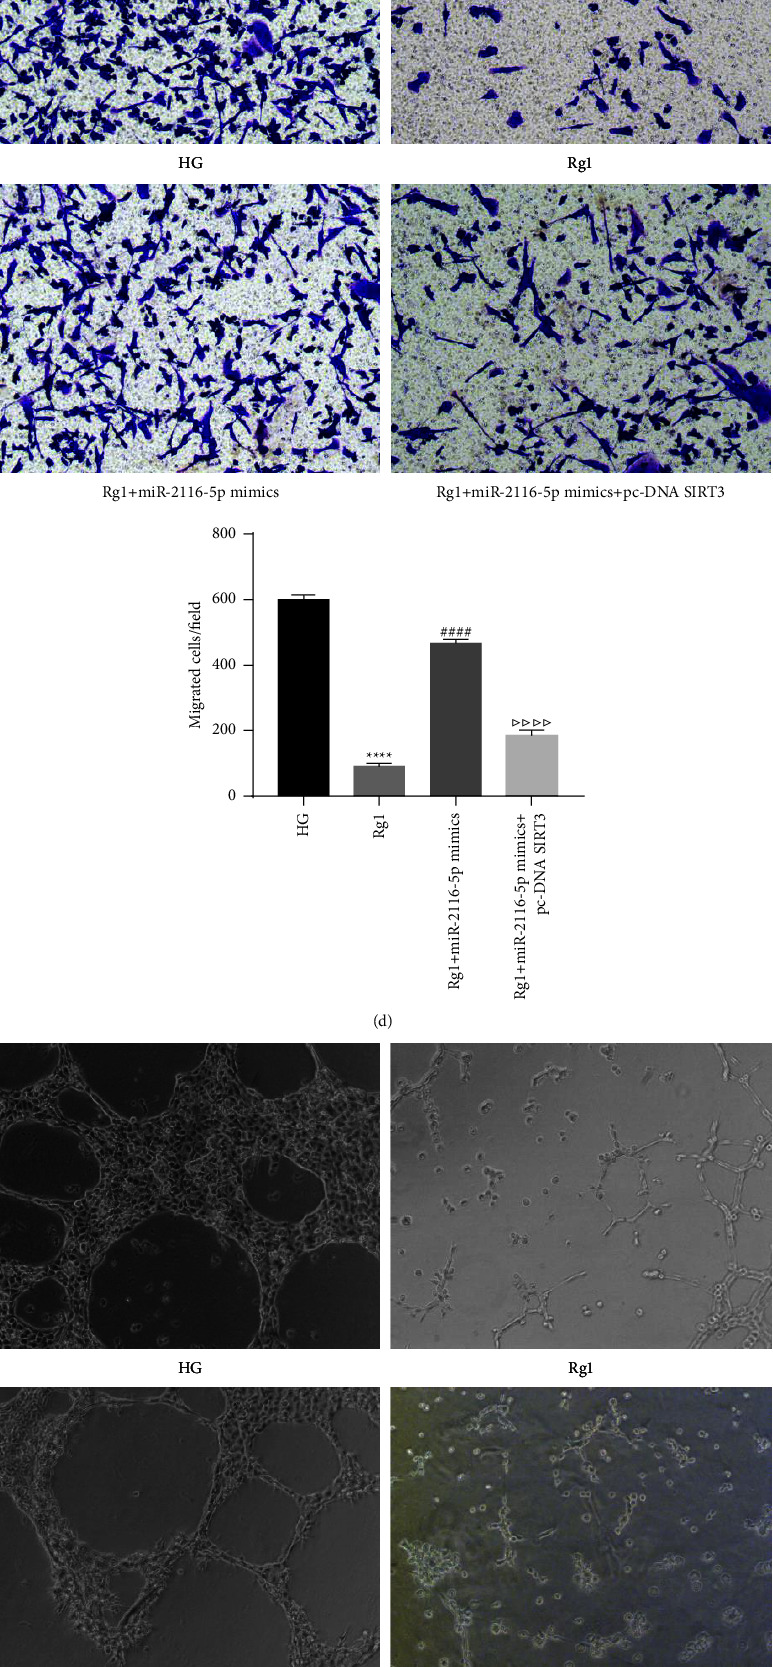
Figure 6.

Rg1 affects the proliferation, migration and angiogenesis of HG-induced HRECs through miR-2116-5p/SIRT3. (a) CCK-8 assay of cell viability. qRT-PCR analysis of miR-2116-5p (b) and SIRT3 (c) expression. (D) Transwell assay of cell migration. (E) Comparison of angiogenesis in different groups. (f) Analysis of the SIRT3 and VEGF protein levels by a western blot analysis. ∗∗∗P < 0.001 and ∗∗∗∗P < 0.0001 compared to the HG group; ##P < 0.01 and ####P < 0.0001 compared Rg1 group; △P < 0.05, △△P < 0.01 and △△△△P < 0.0001 compared to the Rg1+miR-2116-5p mimic group.
